
# Remote Capture
'Remote Capture' feature facilitates you to capture the troubleshooting artifacts (i.e., GC log, thread dump, heap dump, netstat, ...) on a remote device from your yCrash dashboard itself. Using this feature you don't have to login in to the remote device and manually trigger the yc-360 script to capture the troubleshooting artifacts.
Here are the steps to use 'Remote Capture' feature:
# Step 1: Prerequisite
Make sure 'action API' is enabled on the yc-360 script. To learn how to activate 'action API', refer here.
# Step 2: Go to Upload Incident Form.
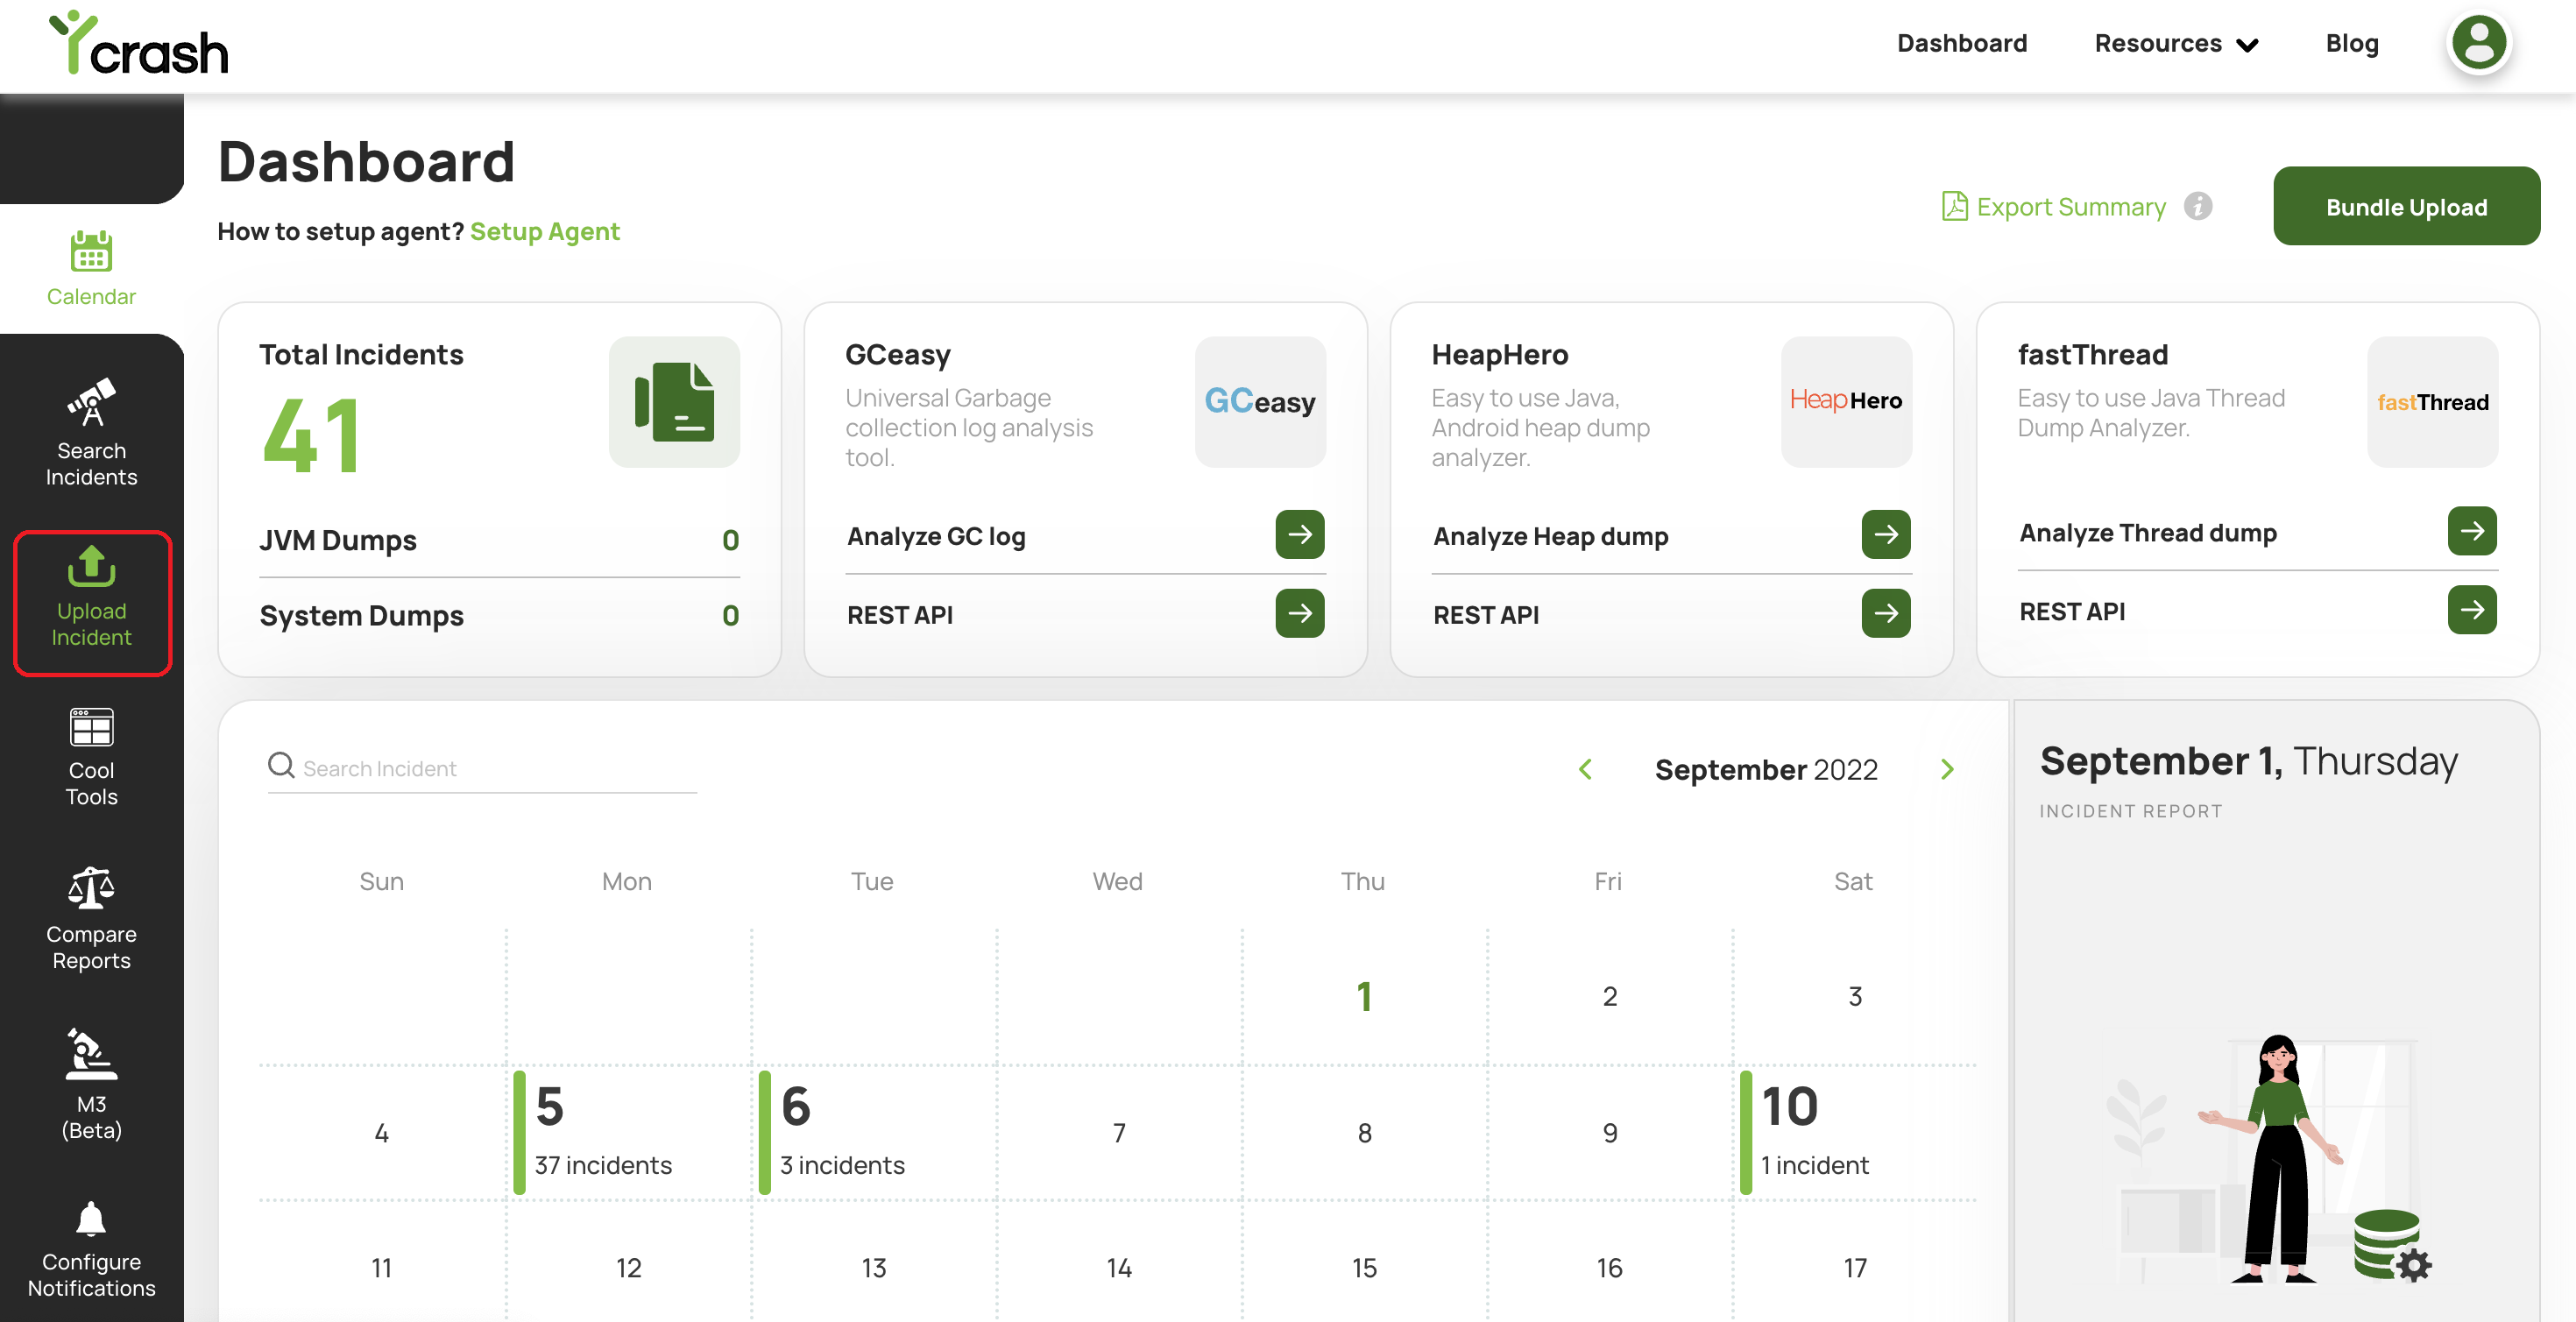
Click on the "Upload Incident" menu item on the left side navbar.
# Step 3: Fill the required Fields.
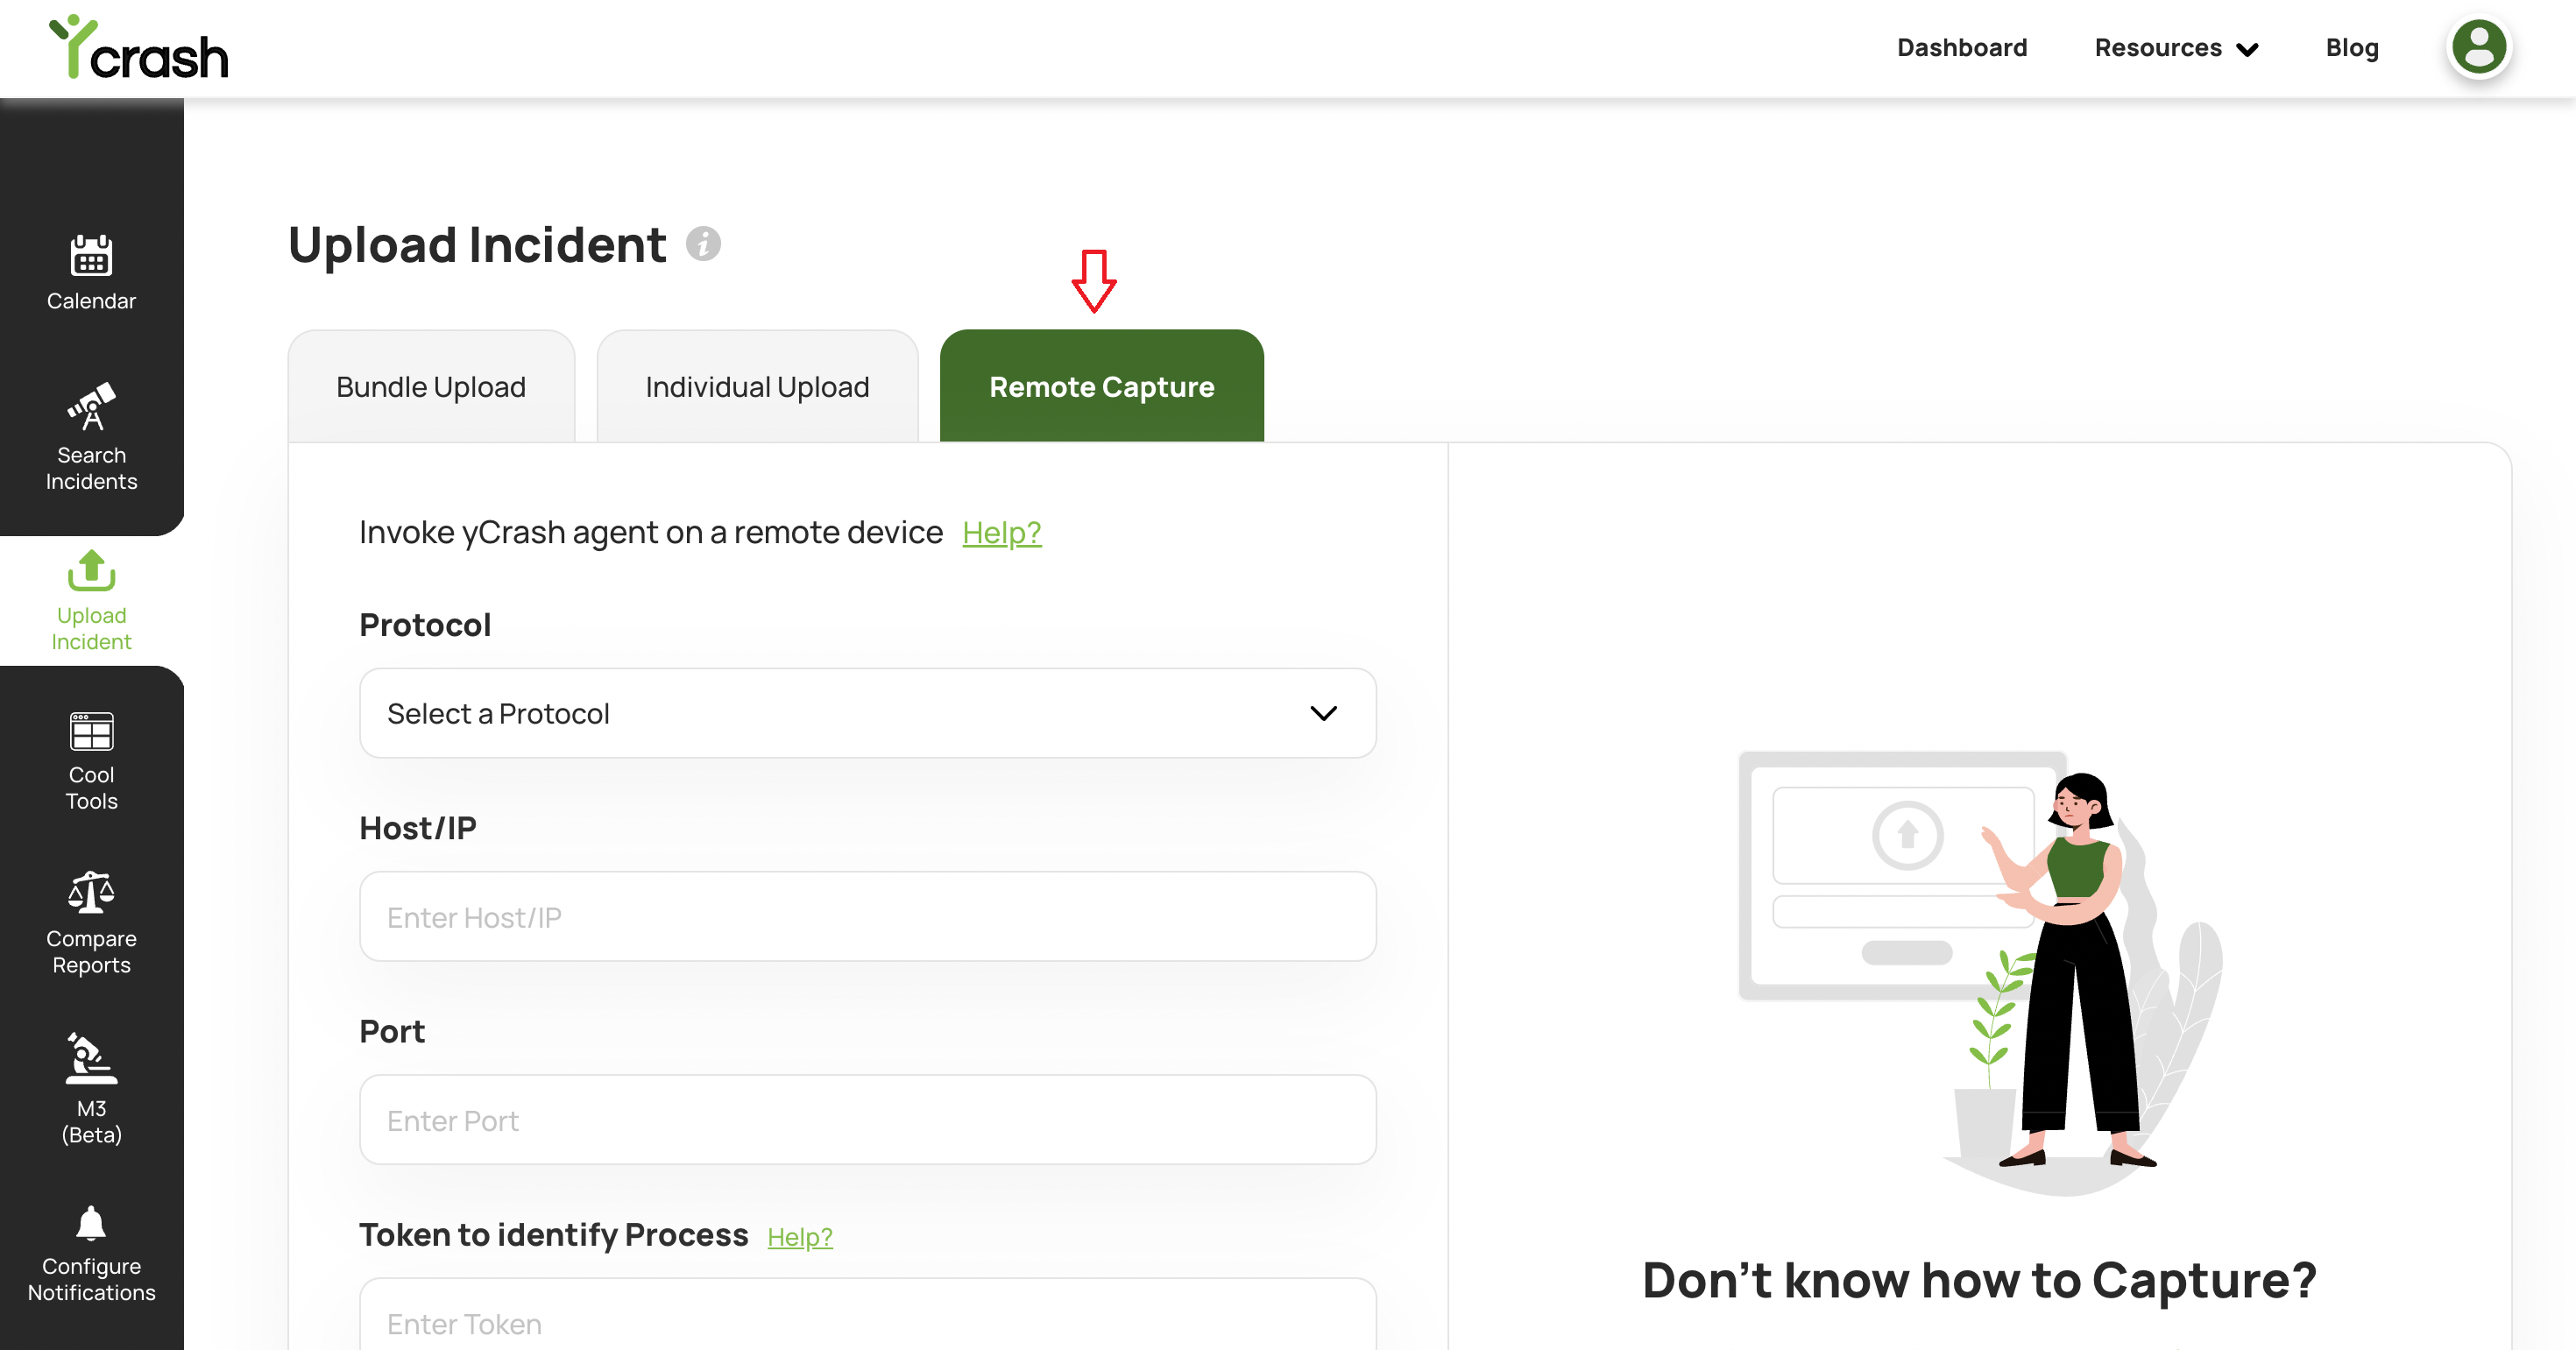
In the 'Upload Incident' page you will see three tabs: 'Bundle Upload' , 'Individual Upload' and 'Remote Capture'. Click on the 'Remote Capture' tab.
'Remote Capture' tab contains following input fields:
Protocol: Choose HTTP or HTTPS from the dropdown menu, based on whether yc-360 script is configured to run on HTTP or HTTPS
Host/IP: Enter the hostname or the IP address of the remote device on which you want to capture the artifacts
Port: Enter the port number in which the yc-360 script is listening (i.e. basically the value you have configured in the 'port' argument of the yc-360 script)
Token to identify process: On the host multiple processes will be running. You need to enter a unique token that will identify the process on which you want to capture the artifacts. You can pass the process Id of the process or any unique argument with which the process was launched. You can also pass certain predefined tokens. For more details refer to 'Identifying Process' section.
# Step 4: Click on Capture and get the report.
Once you fill in the fields, click on the 'Capture' button.
Once you click on the 'Capture' button, yCrash will capture all the artifacts on the remote device and generate a root cause analysis report.