# Compare Reports
The Compare Report feature allows you to compare two incident reports to understand how application behavior has changed between two recordings.
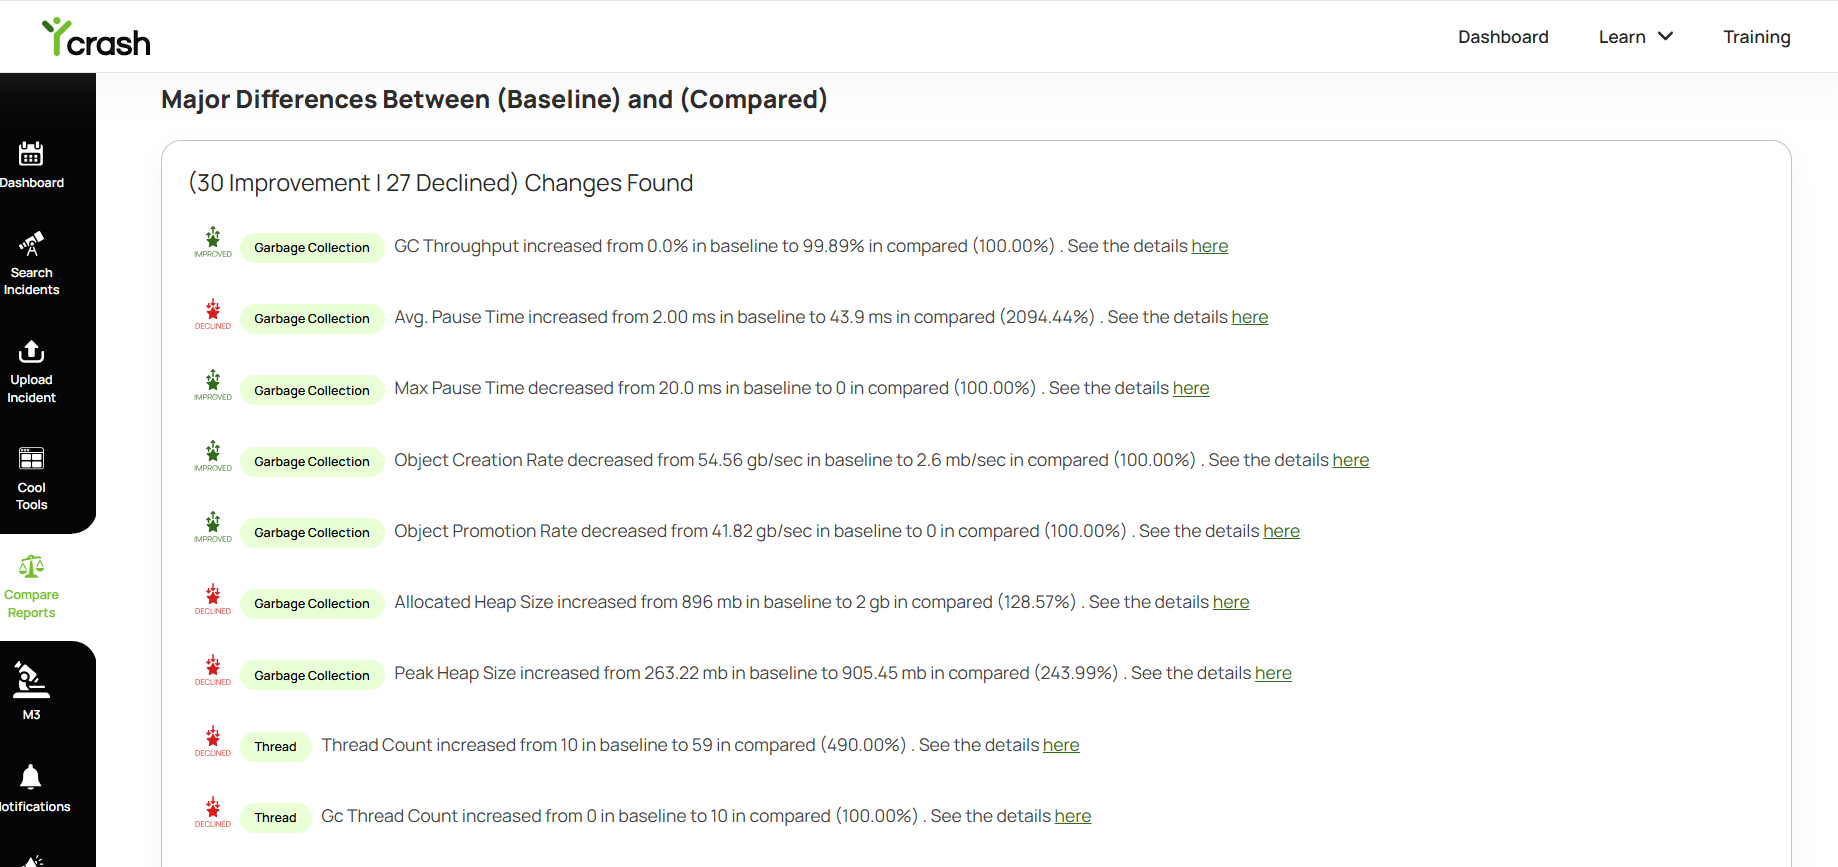
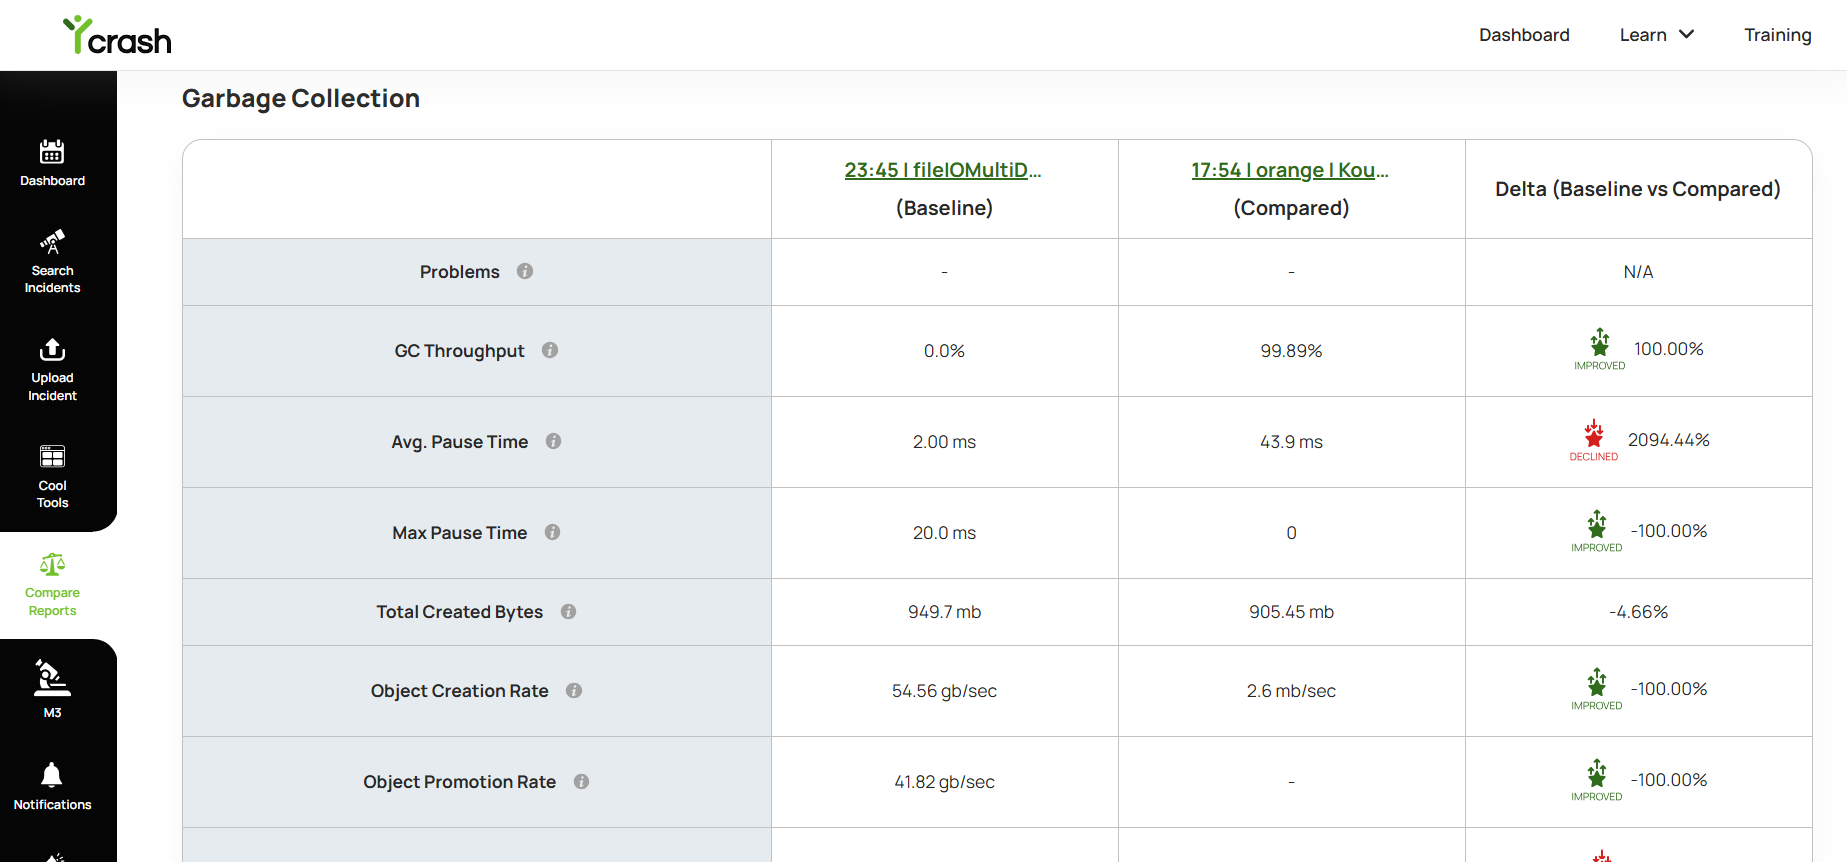
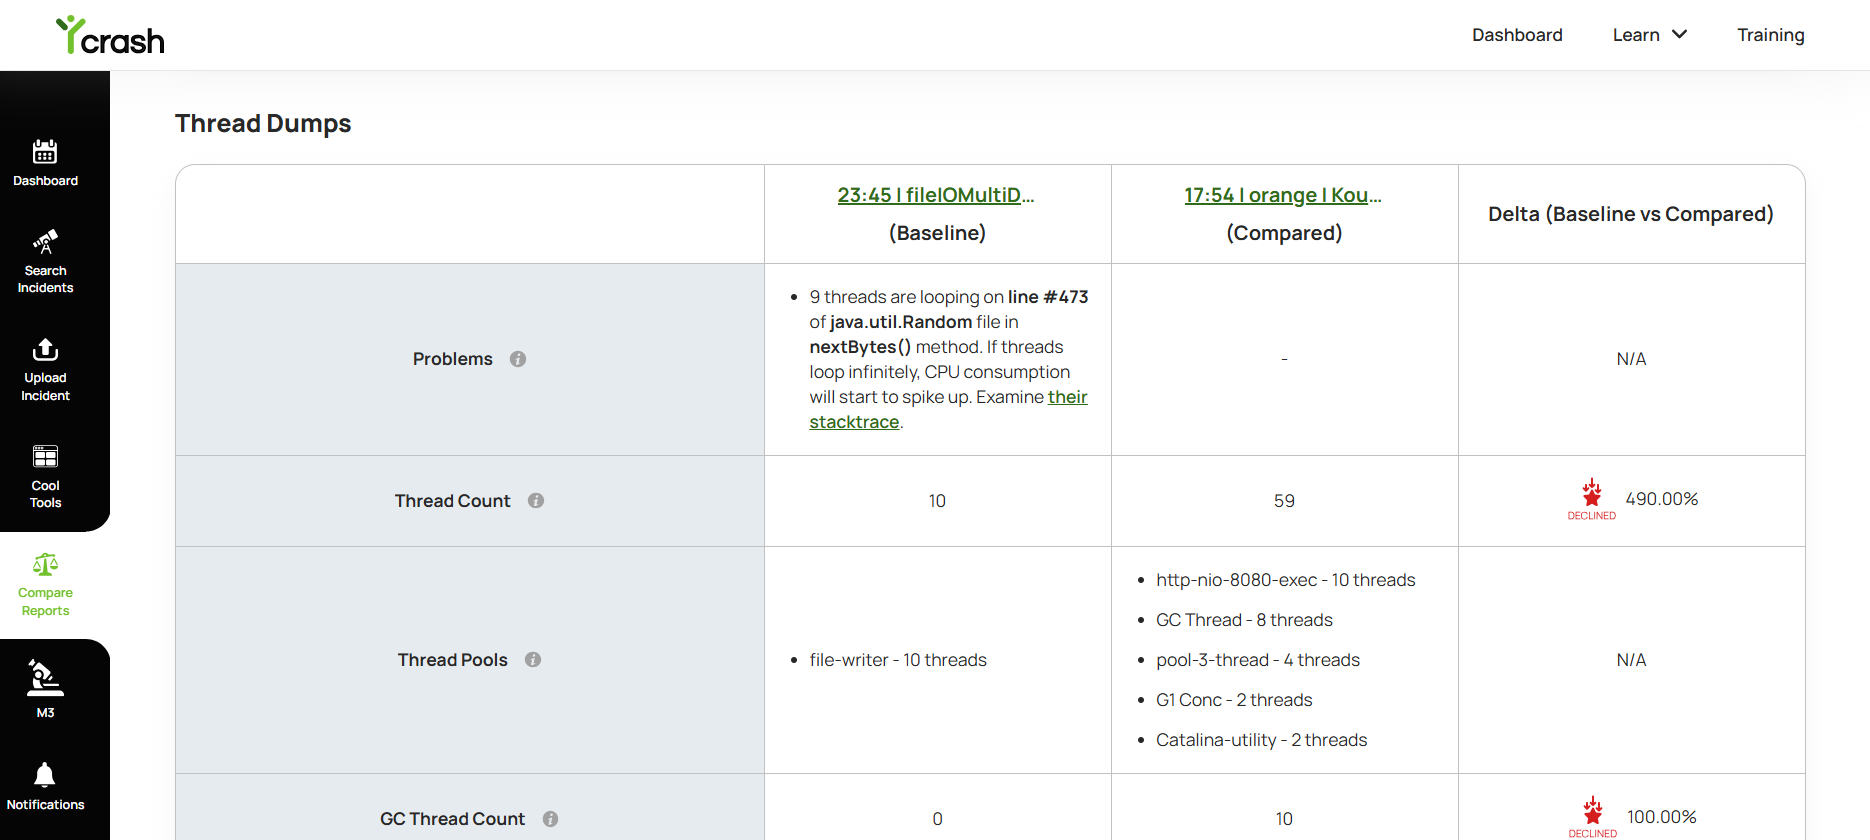
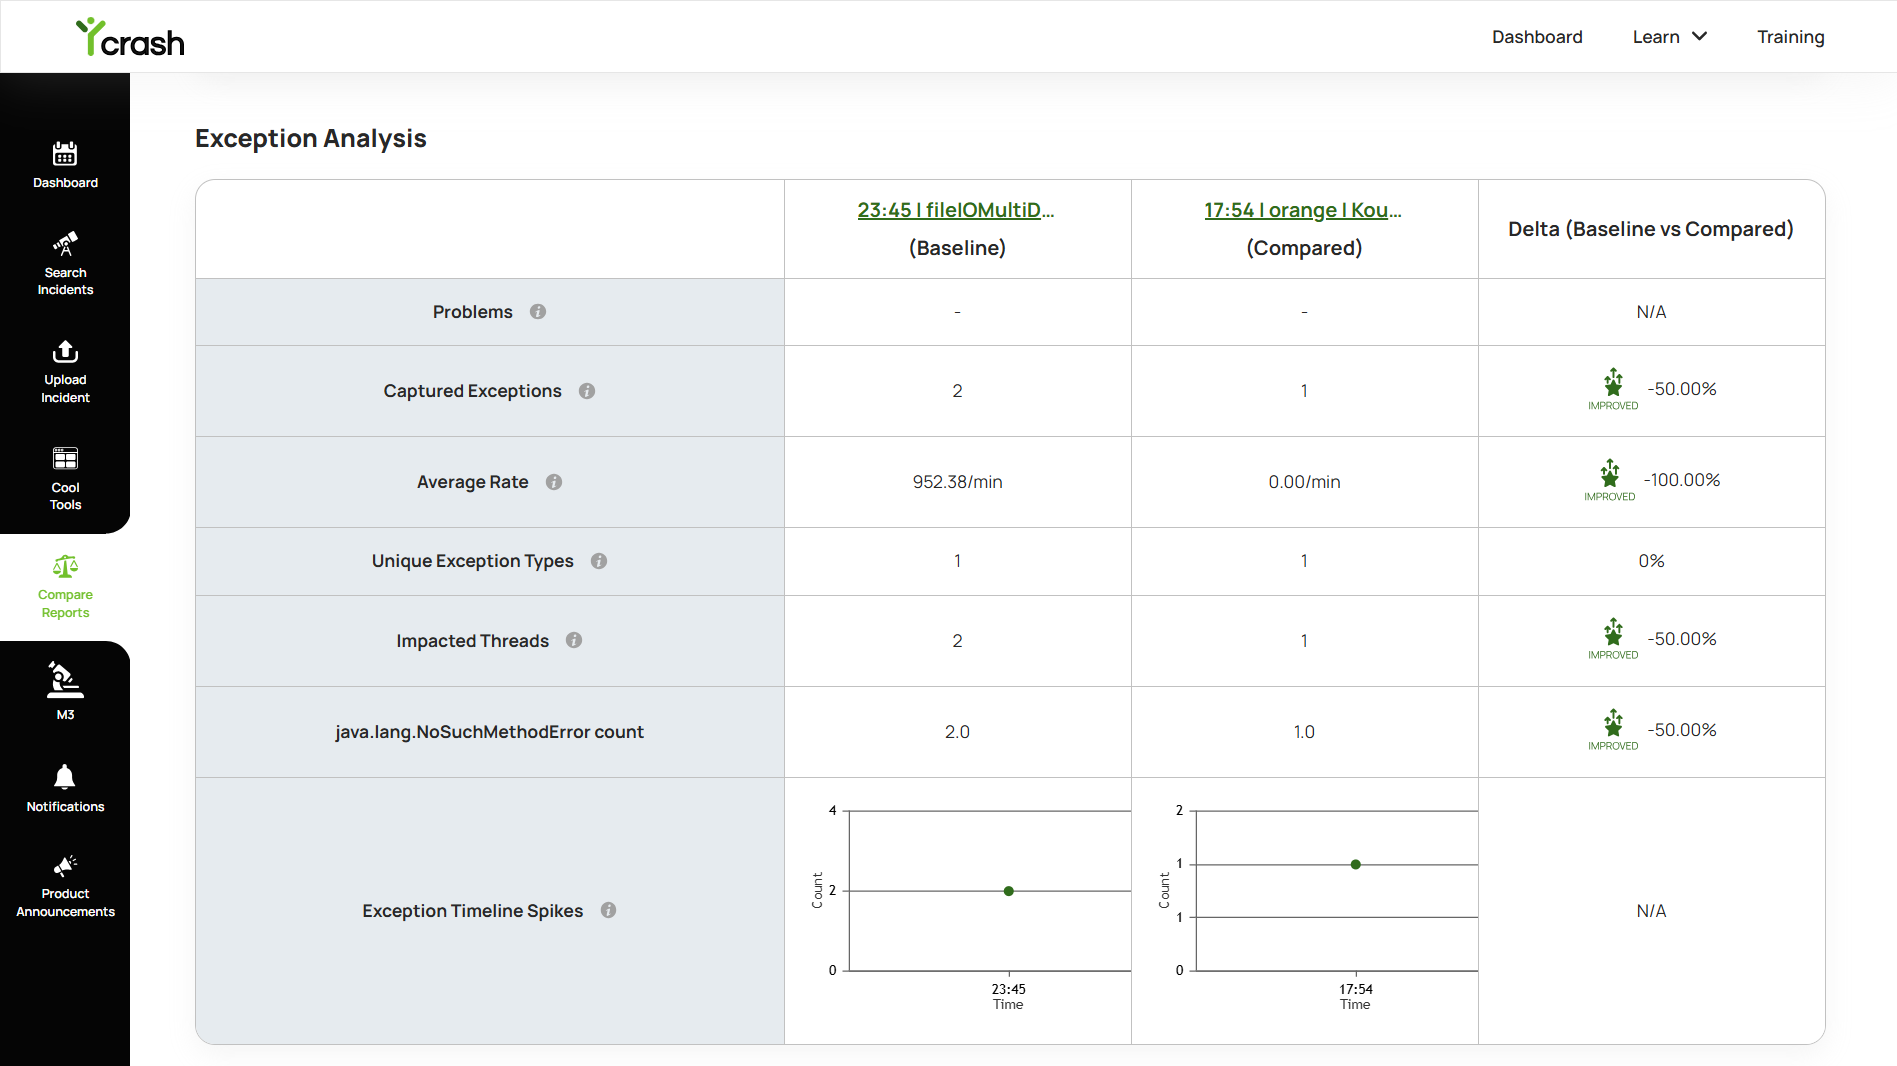
You can select one report as the Baseline and another as the Compared report. The comparison highlights significant differences between the two reports, making it easier to identify performance improvements, regressions, and changes in application behavior. The enhanced Compare Report provides comparison insights across multiple diagnostic areas, including application logs, garbage collection, thread dumps, heap, processes, CPU, memory, storage, network, exceptions, method profiling, JVM internals, file I/O, and environment details. The report also provides an AI Overview, which uses an LLM provider configured by the user to summarize the key differences identified between the two reports and provide a concise overview of the comparison.
With Compare Report, you can:
- View metrics side by side for 2 reports at a time
- Spot differences in key metrics like GC behavior, thread activity, memory usage, and more
- Reduce time to find root cause by eliminating the need to open each report individually
This feature is especially useful when you're dealing with performance degradation, memory leaks, thread contention, or other intermittent issues. Simply select the reports you want to compare, and let the tool highlight the critical differences for you.
# STEP 1: Go to the Compare reports
From the yCrash dashboard page, click on the Compare reports menu from the left side navbar. It will open the "Compare reports" page.
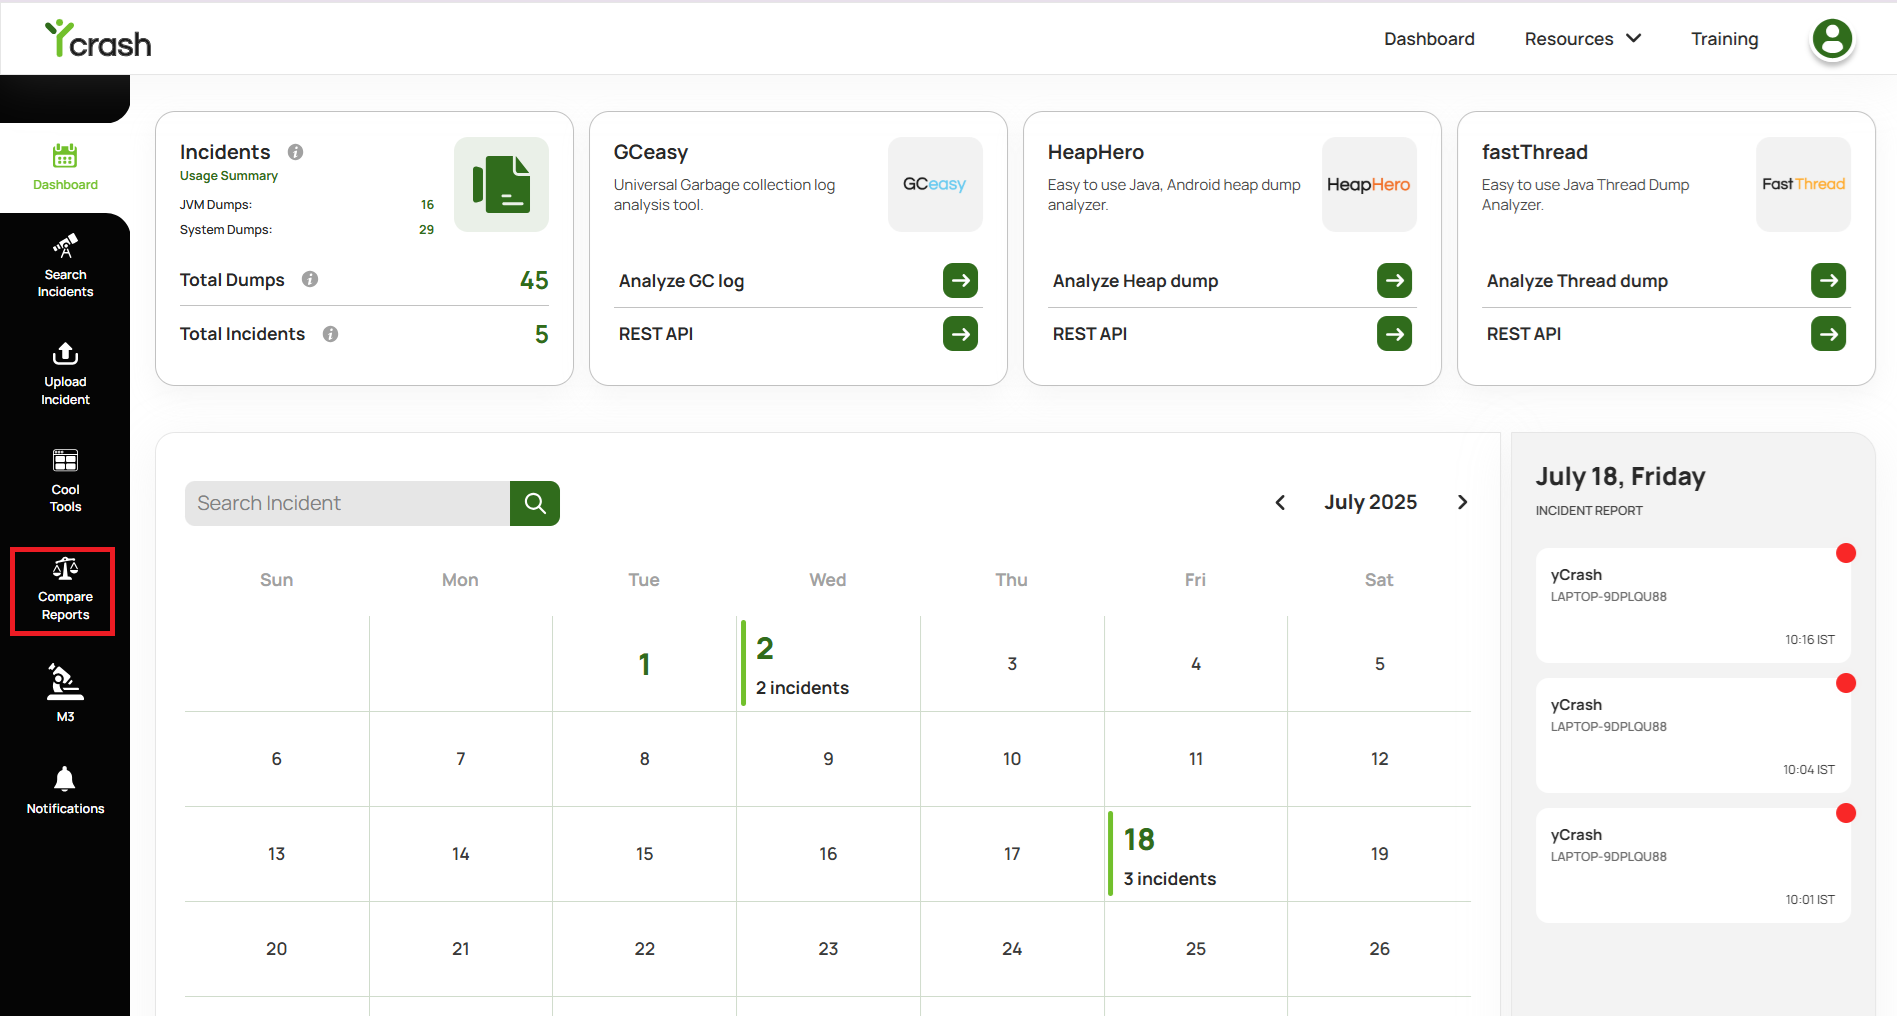
Fig 1: Navigating to the Compare report
# STEP 2: Select the 'Baseline' report
Click on 'Baseline', select the date from which you want to compare incidents, and a list of incidents will be displayed. Choose the one you want to compare.
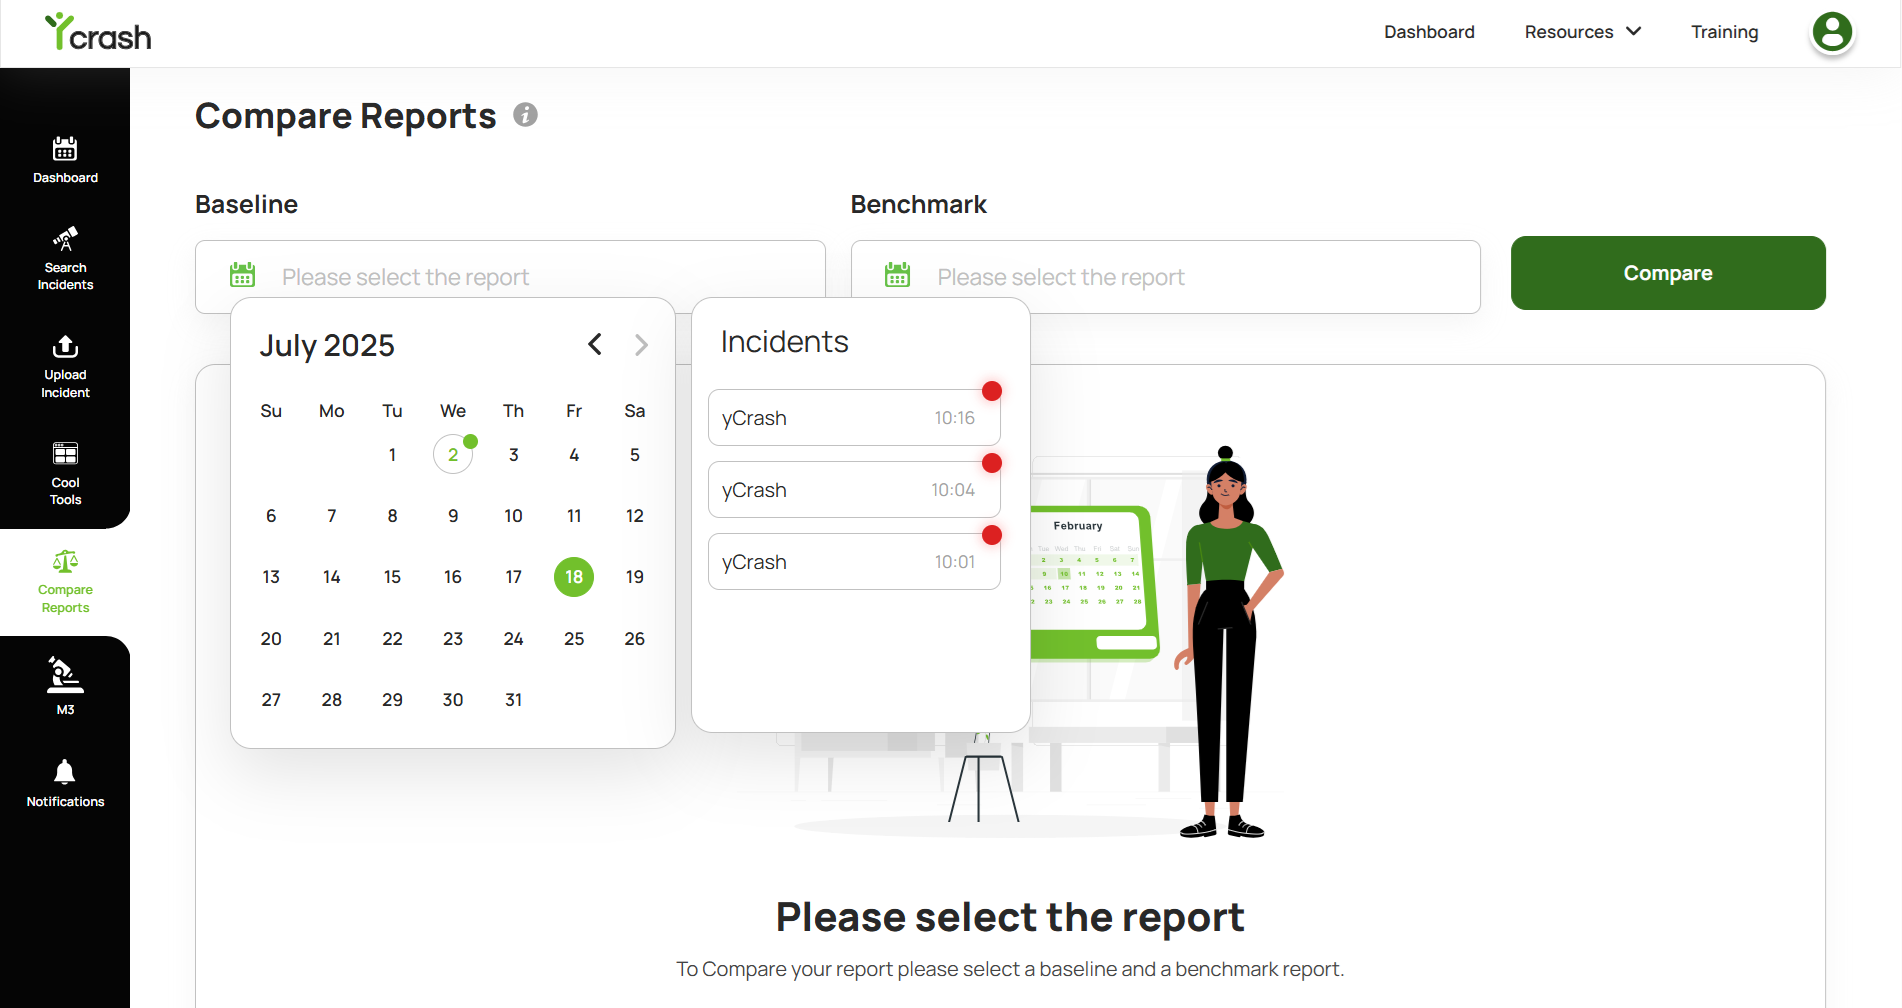
Fig 2: Choosing ‘Baseline’ report for comparison
# STEP 3: Select the 'Compared' report
Click on 'Compared', select the date for comparison, and a list of incidents will be displayed. Then, choose the incident you want to compare with.
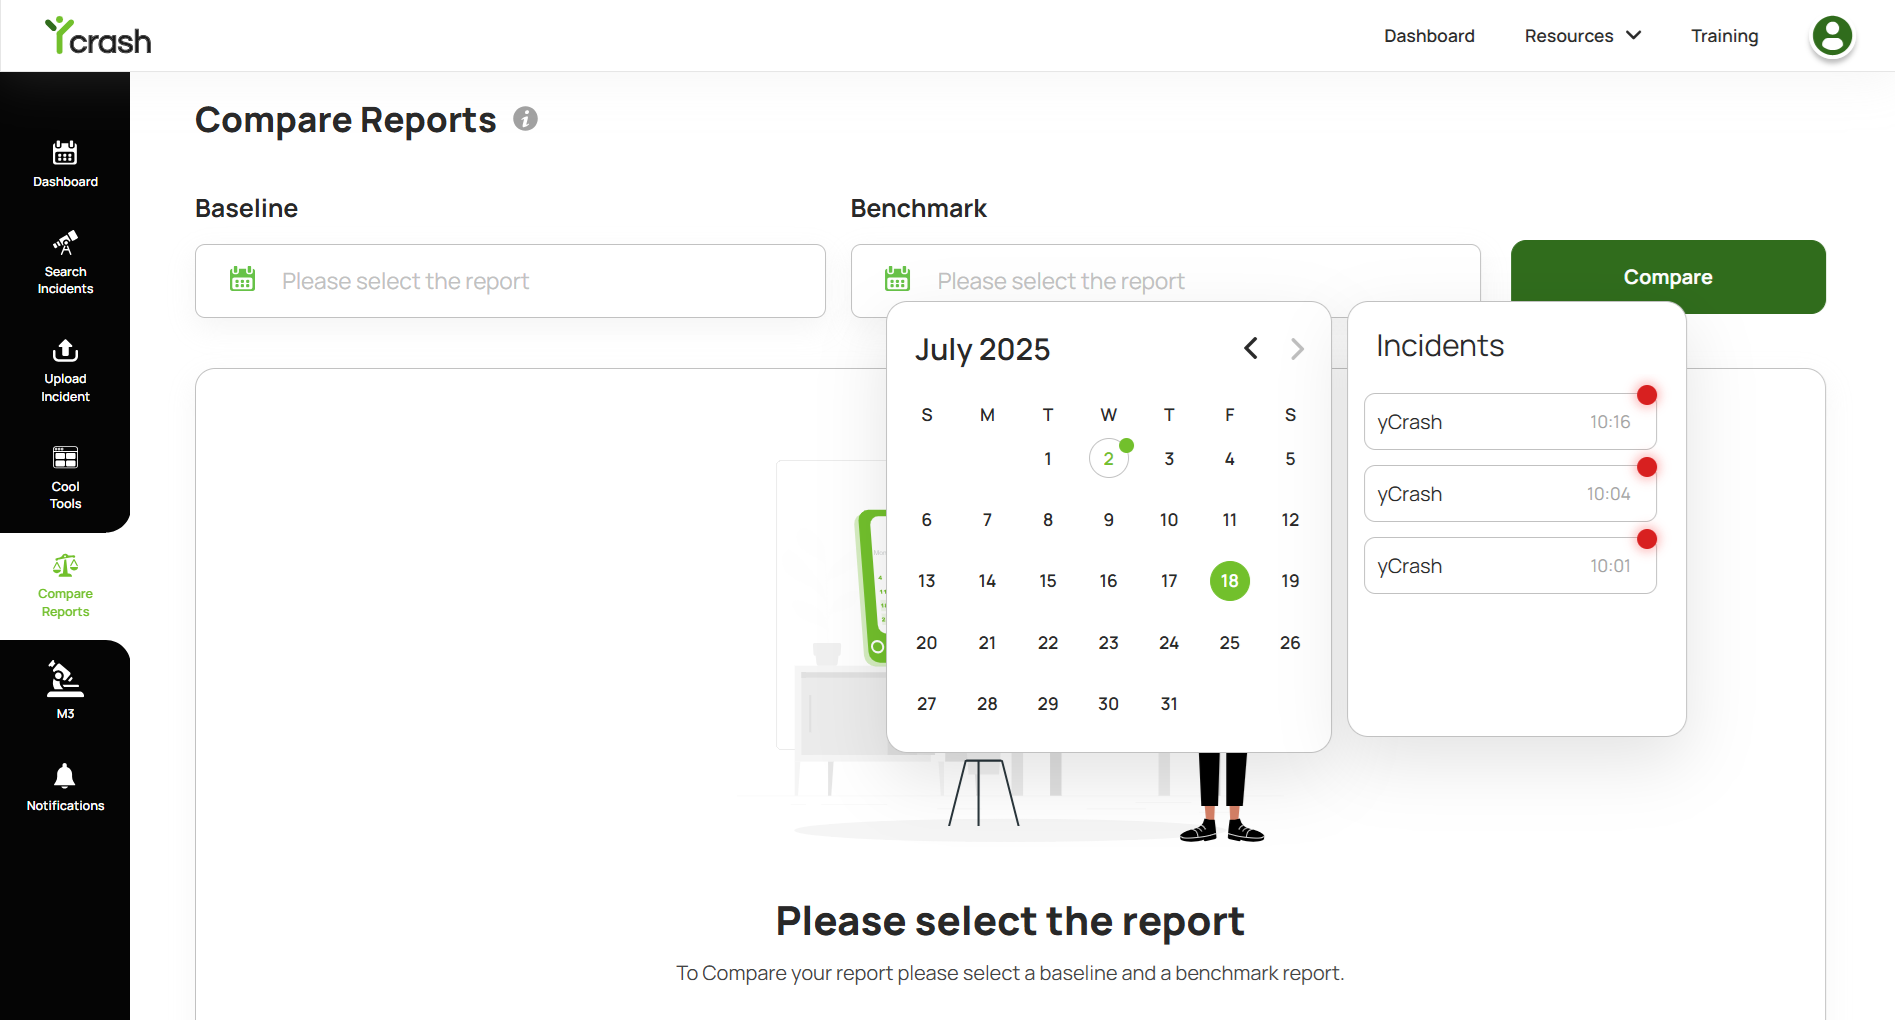
Fig 3: Choosing ‘Compared’ report for comparison
# STEP 4: Click on the "Compare" button
After choosing 'Baseline' report & 'Compared' report, click on the "Compare" button, All the reports associated with the selected incidents will be displayed for side-by-side comparison.
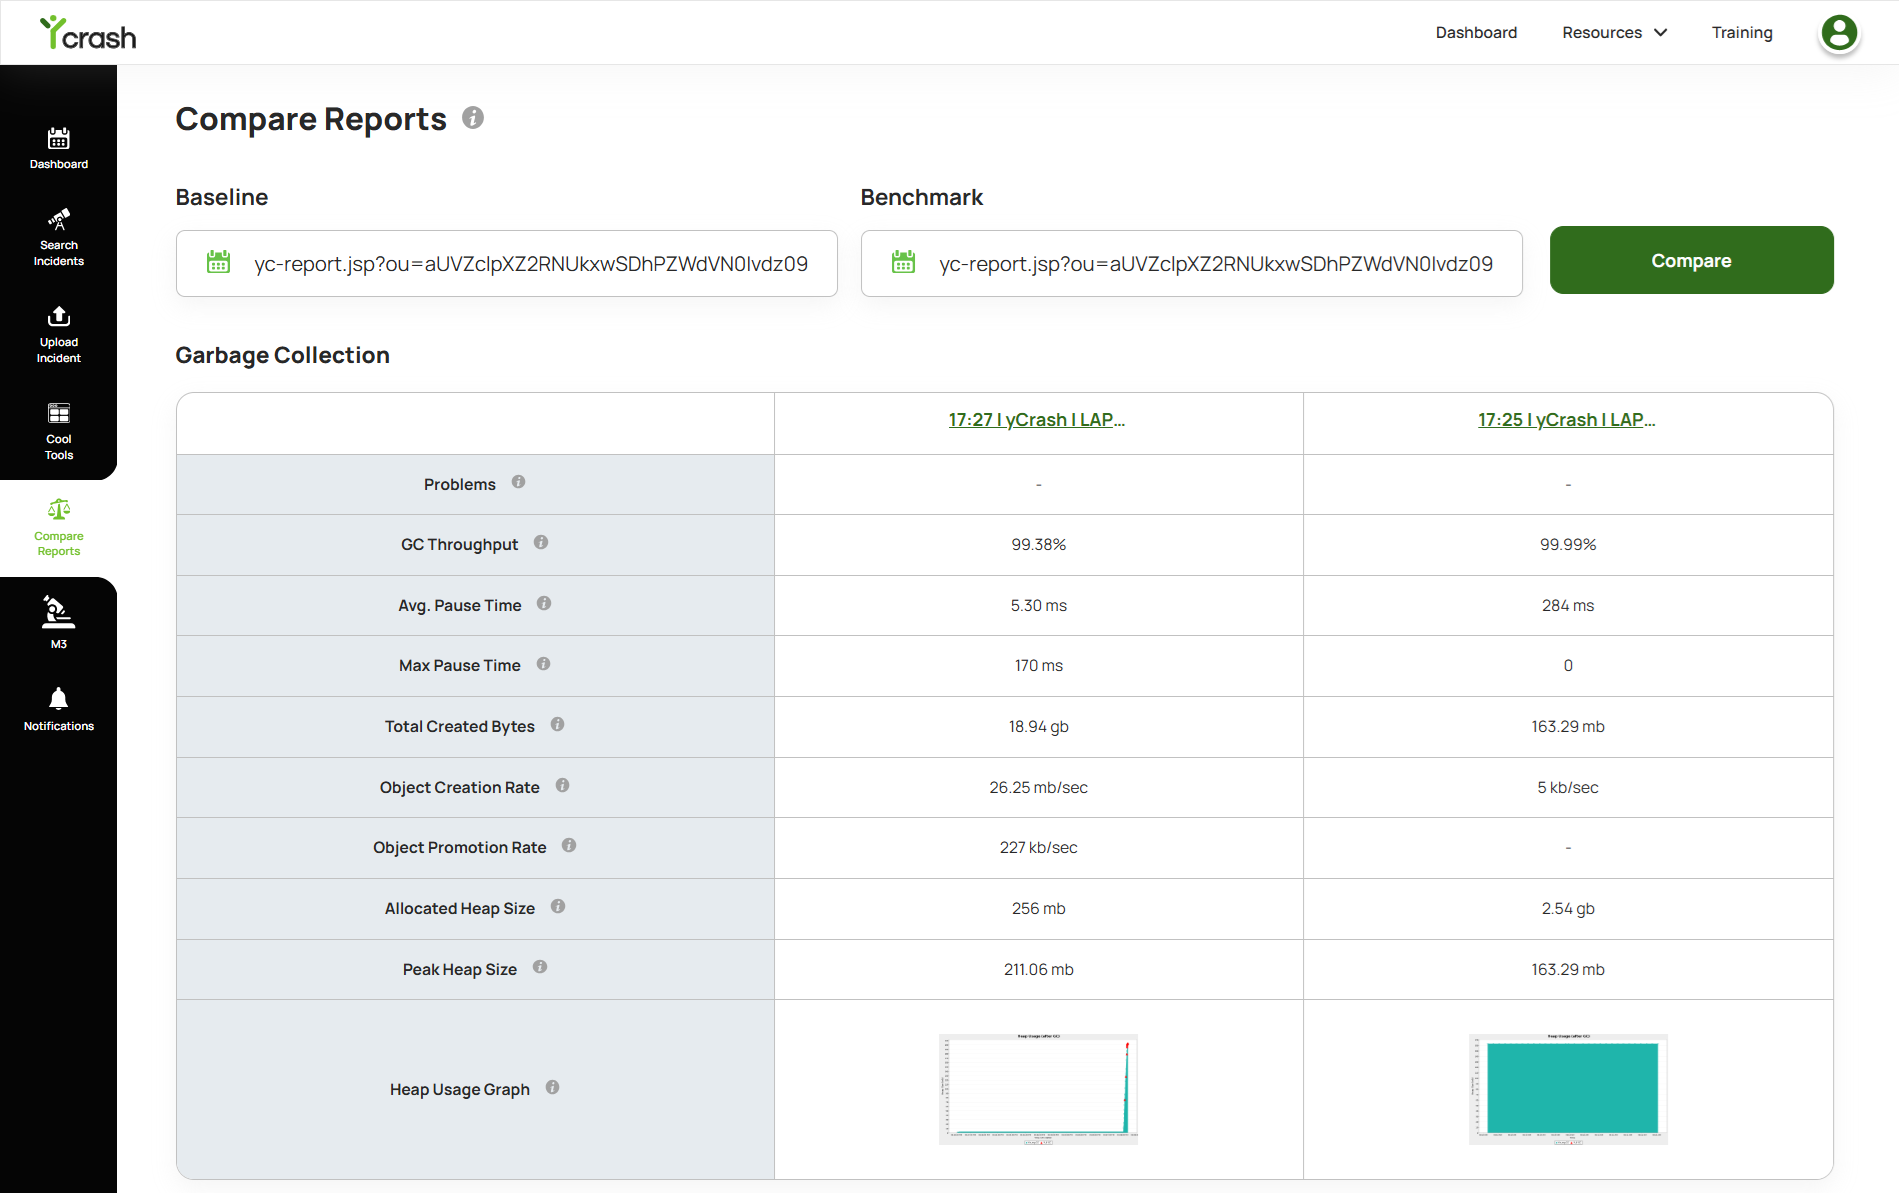
Fig 4: Selected incidents will be displayed for side-by-side comparison
Example Comparison Reports