
# My Patterns
# Introduction
The "My Patterns" feature allows users to define custom patterns by specifying a pattern name and a corresponding stack trace. When a thread report is generated, the system will highlight the specified stack trace in yellow for any matching threads. This feature enhances the visibility of specific thread traces, making it easier for users to identify and analyze relevant information in the thread report
# Feature Overview
The key functionalities of the "My Patterns" feature include:
Pattern Creation: Users can create custom patterns by providing a unique pattern name and the associated stack trace.
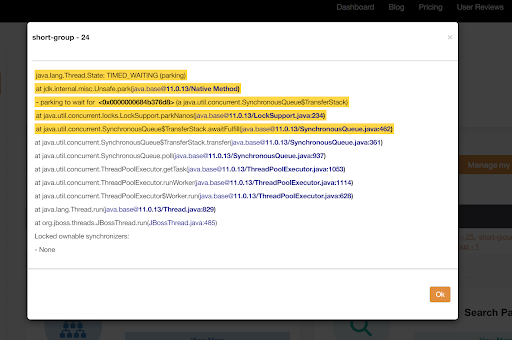
Thread Report Highlighting: When a thread report is generated, the system compares the defined patterns with the thread traces. If a match is found, the corresponding stack trace in the thread report in my pattern section highlighted in yellow.
Matching Threads List: In the "My Patterns" section, users can view a list of threads that match the defined patterns. The system provides a convenient way to identify and explore the threads associated with each pattern.
# Examples
# Creating a Pattern
Pattern Name: DatabaseConnectionIssue
Stack Trace:
at com.example.DatabaseConnector.openConnection(Databaseconnector.java:50)
at com.example.Application.runQuery(Application.java:100)
2
# Getting Started
To get started with "My Patterns," follow these steps:
Upload a thread dump using the provided tool.
Once the report is loaded, scroll down to the end of the report to find the "My Patterns" section.
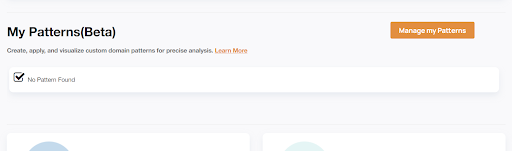
Click on "Manage My Patterns" to navigate to the "My Patterns" page within the application.
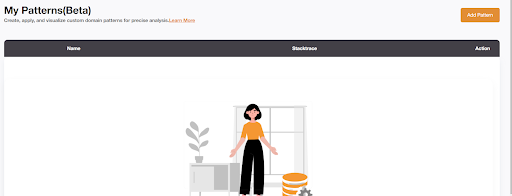
On the "My Patterns" page, click on "Add Pattern" to create a new pattern.
Provide a unique name for the pattern.
Enter the stack trace that you want to highlight in the thread report.
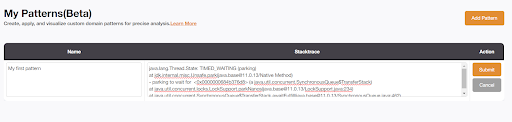
Save the pattern.
If the pattern matches any of the threads in the "My Patterns" section of the thread report, a list of matching threads will be displayed.
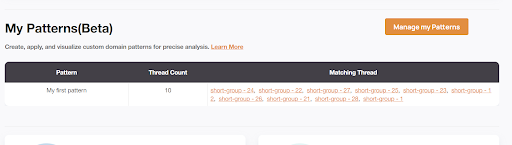
In My Pattern table it will display the number of threads is matching in the thread count column.
Click on any of the matching threads it will open a popup. In this popup, you can observe the stack trace highlighted, indicating the matching pattern.
# Configuration
No specific configuration is required for this feature. Simply create and save your custom patterns through the user interface.
# How to Use?
# Creating a Pattern
Follow the steps in the "Getting Started" section to create a new pattern.
# Viewing Highlighted Thread Reports
When generating a thread report:
- Access the thread report through the designated section.
- Look for threads that match the defined patterns.
# Troubleshooting
- If the stack trace is not highlighting as expected, ensure that the pattern is correctly defined, including any special characters or formatting.
# Best Practices
- Keep pattern names descriptive for easier identification.
- Regularly review and update patterns based on evolving application requirements.
# Frequently Asked Questions (FAQ)
# 1. How many patterns can I create?
There is no strict limit on the number of patterns you can create, but it's recommended to keep the list manageable for better usability.
# Conclusion
The "My Patterns" feature empowers users to customize thread reports, making it easier to identify and focus on specific stack traces of interest. Regularly review and update patterns to ensure they align with the evolving needs of your application.