
# How to integrate yCrash with IBM Instana?
# Prerequisites
In this documentation, we assume that you have already installed and setup Instana and your applications are being monitored by Instana. If you haven’t installed it yet then you may want to check Instana official documentation (opens new window).
# Configure webhook endpoint URL in Instana
Please follow the below steps to create alert channel:
Click on the "Settings" menu from the left sidebar.
From the settings page click on the "Alert Channels" tab.
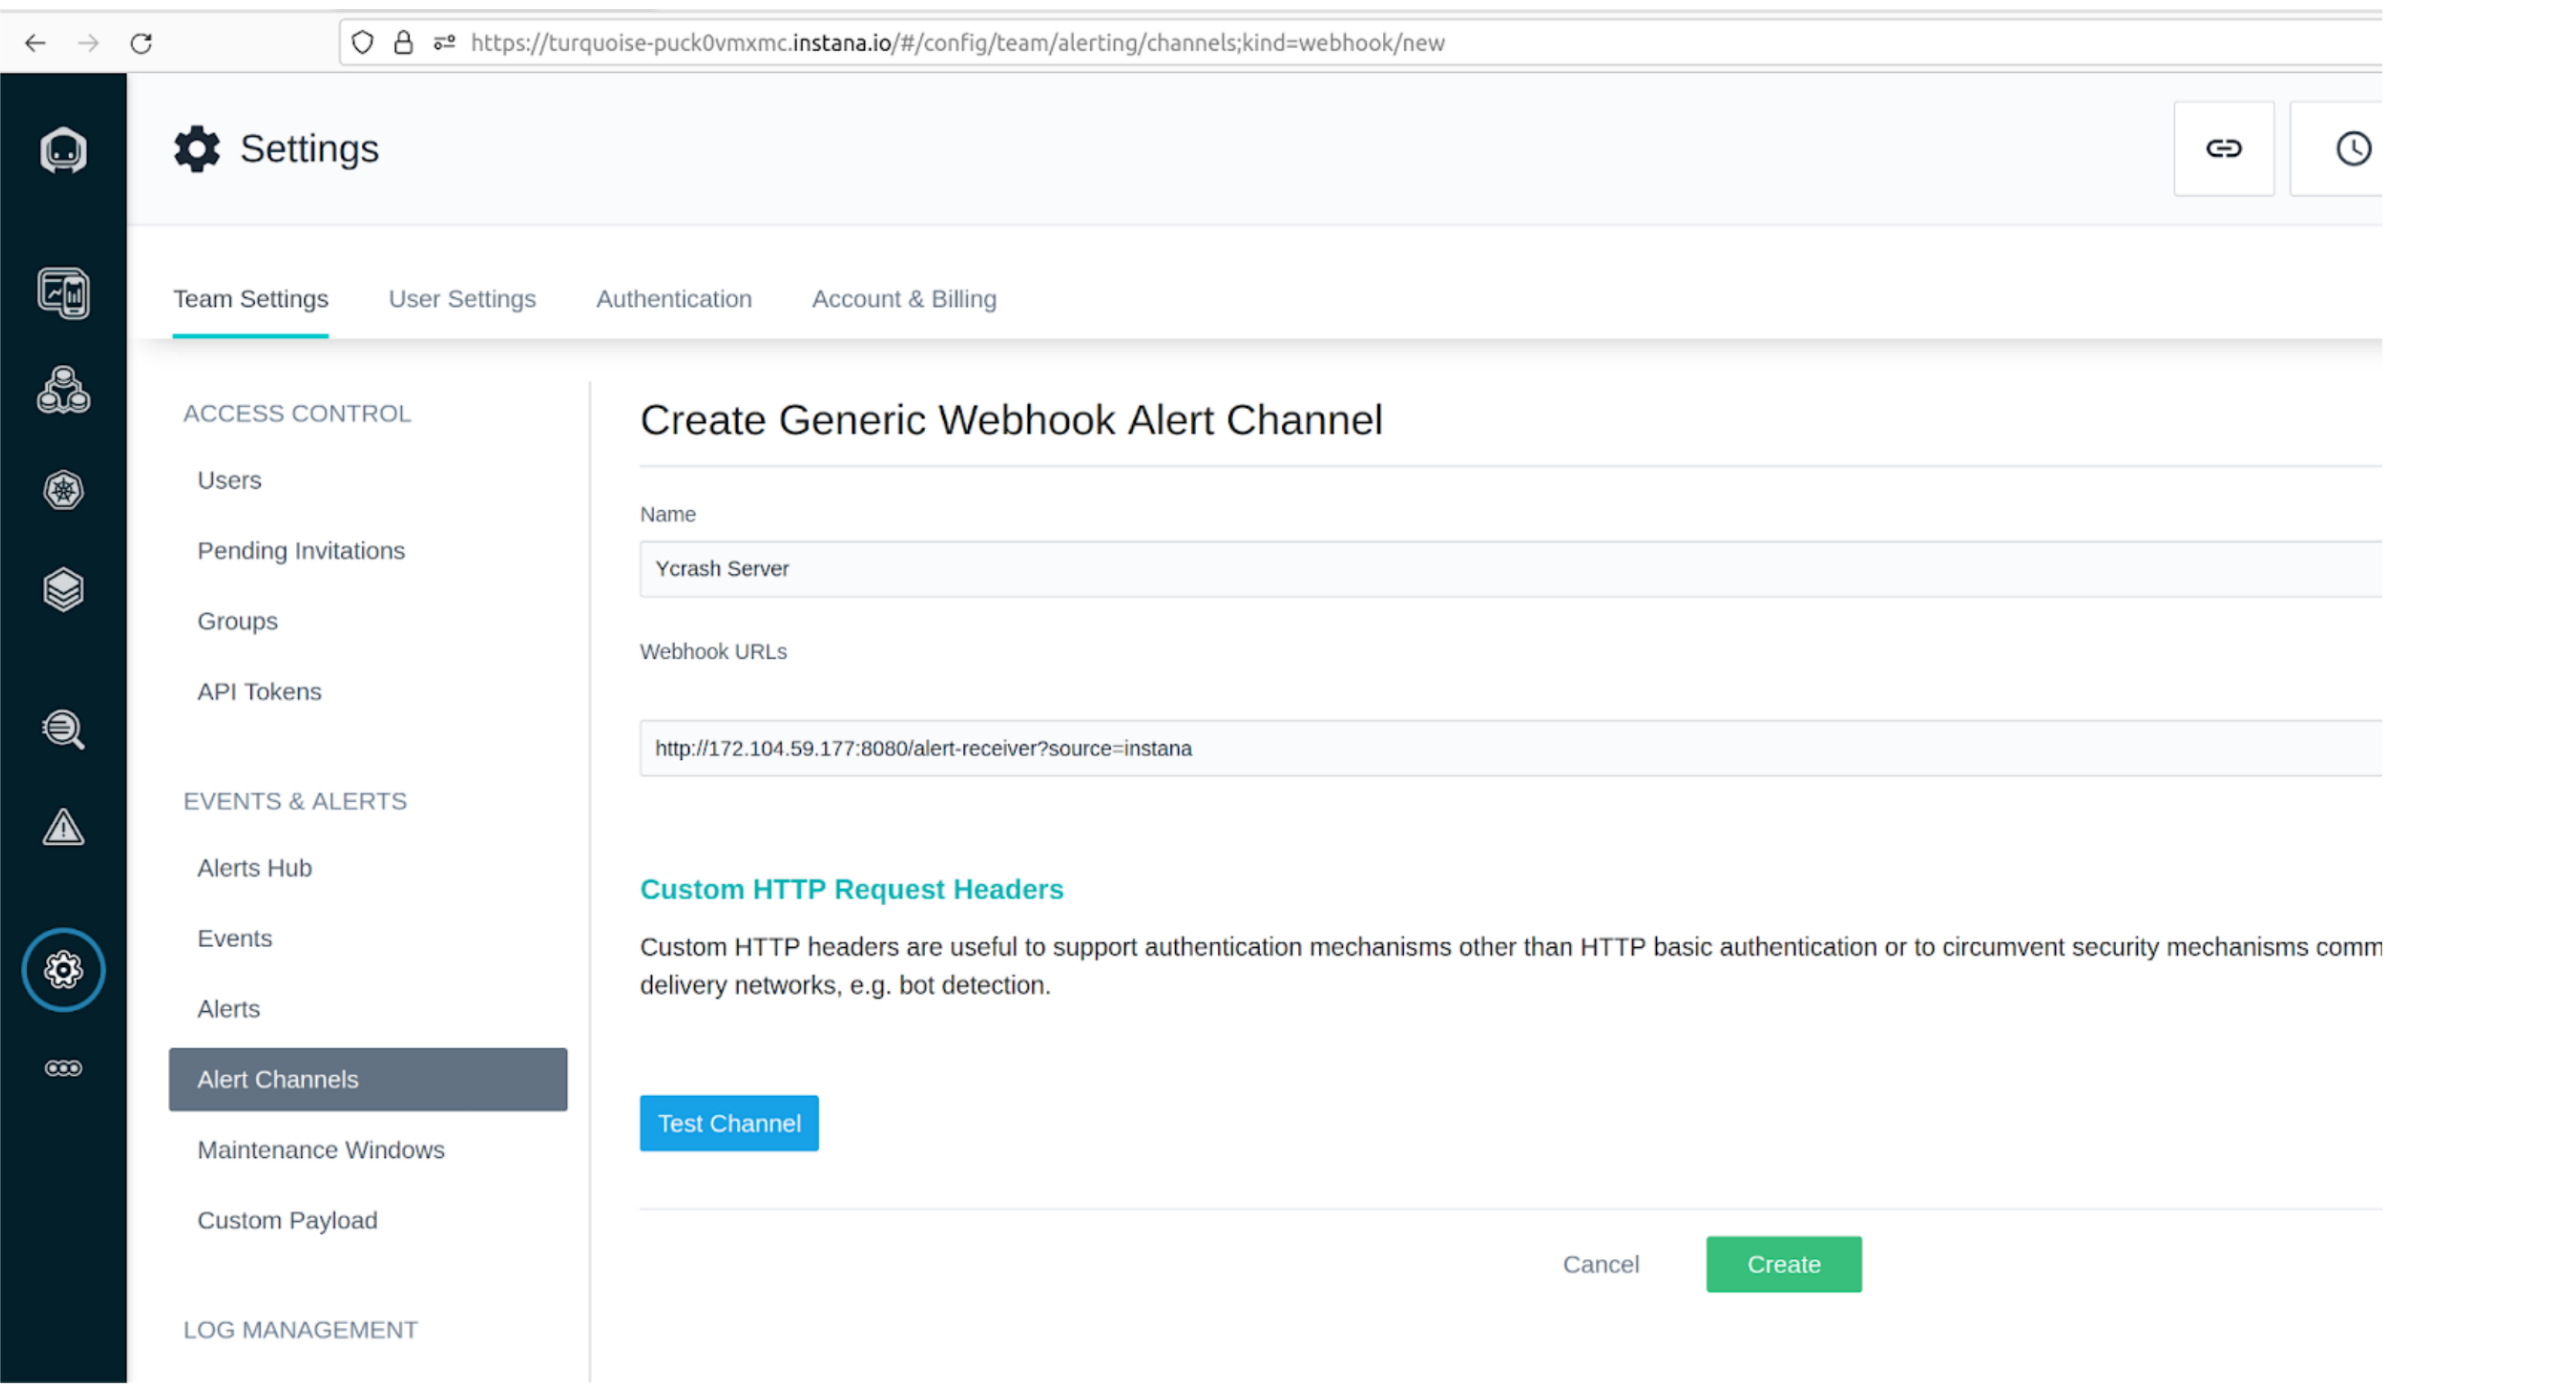
Next click the "+ Add Alert Channel" and choose "Generic Webhook".
Now fill the form:
a. Name: "yCrash Integration"
b. Webhook URLs:https://<yCrash-server>/alert-receiver?source=instana
c. Click the "Create" button to create the alert channel.
# Creaate Alert
Please follow the below steps to create alert:
Click on the "Settings" menu from the left sidebar.
From the settings page click on the "Alert" tab.
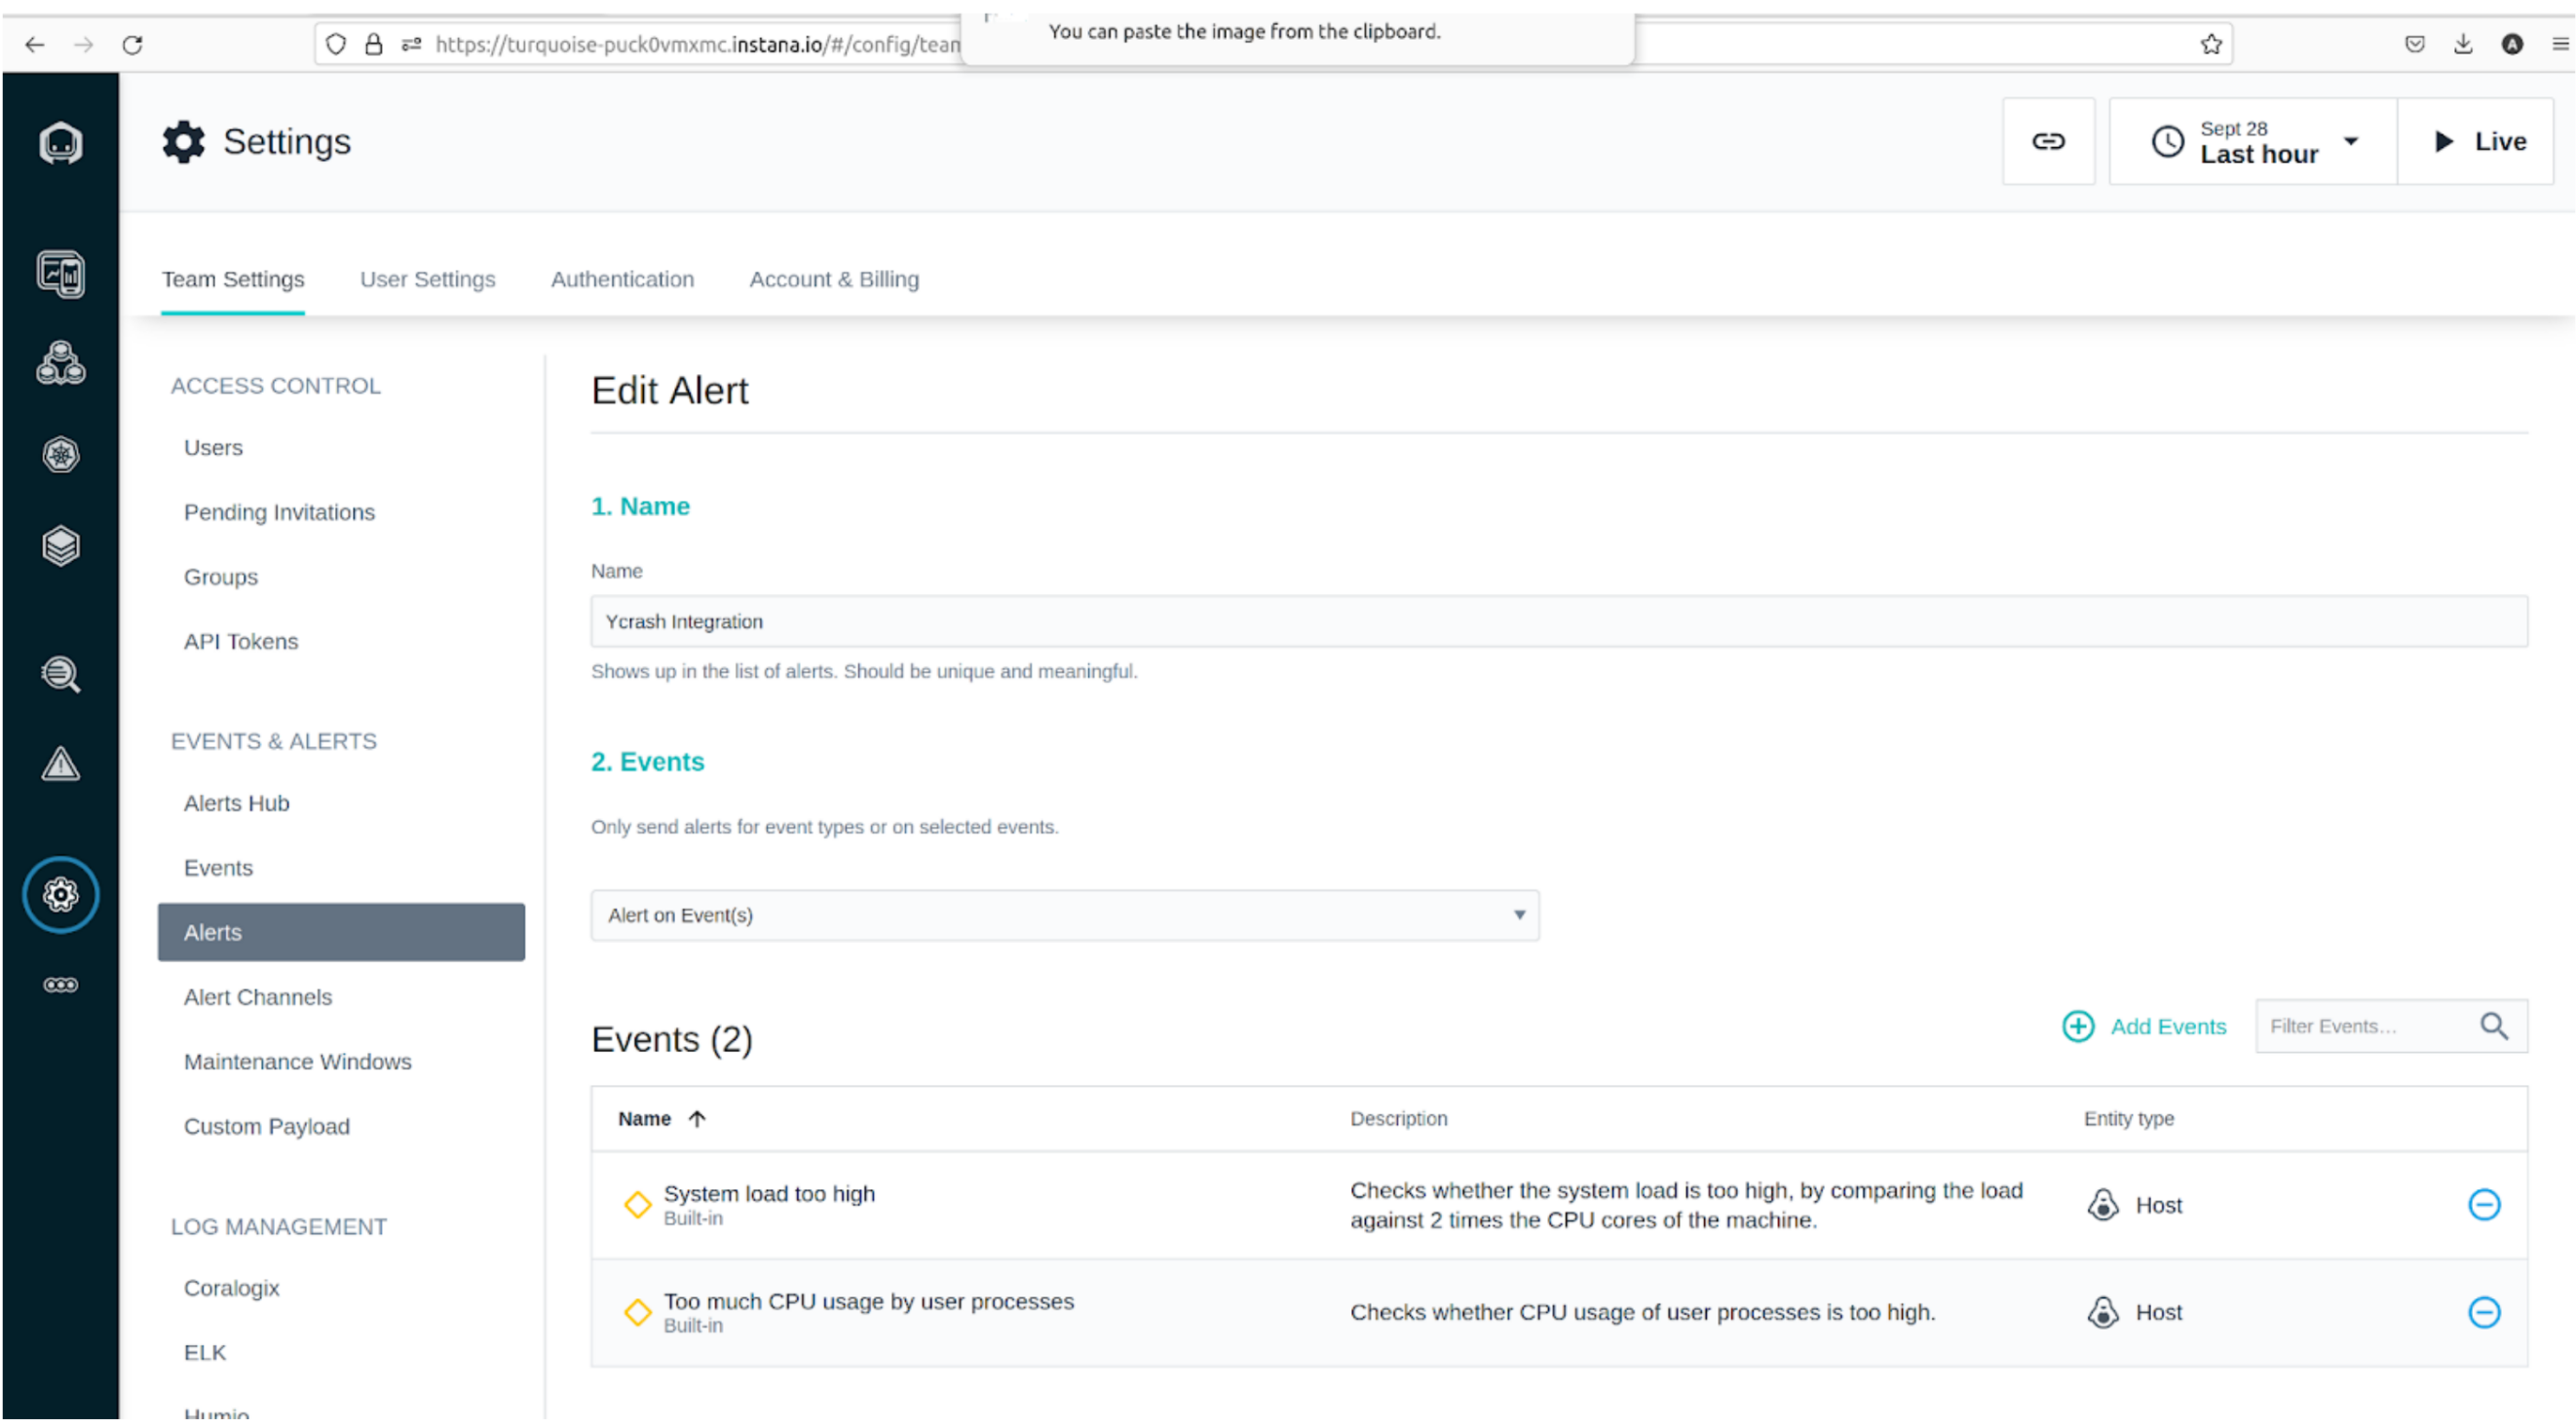
Next click the "+ Add Alert" and fill the form:
a. Name: "yCrash Integration".
b. Events: "Alerts on Event(s)".
c. Now click the "+ Add Event" button to add a new event.
d. Choose your desired events. It can be cpu too high, or custom event with Docker (see the below Docker section).
e. Scope: "All available entities".
f. Under the Alerting section click the "Add Alert Channels" button and choose the one you set up above. In this document, we created an alert channel "yCrash Integration" in the above step.
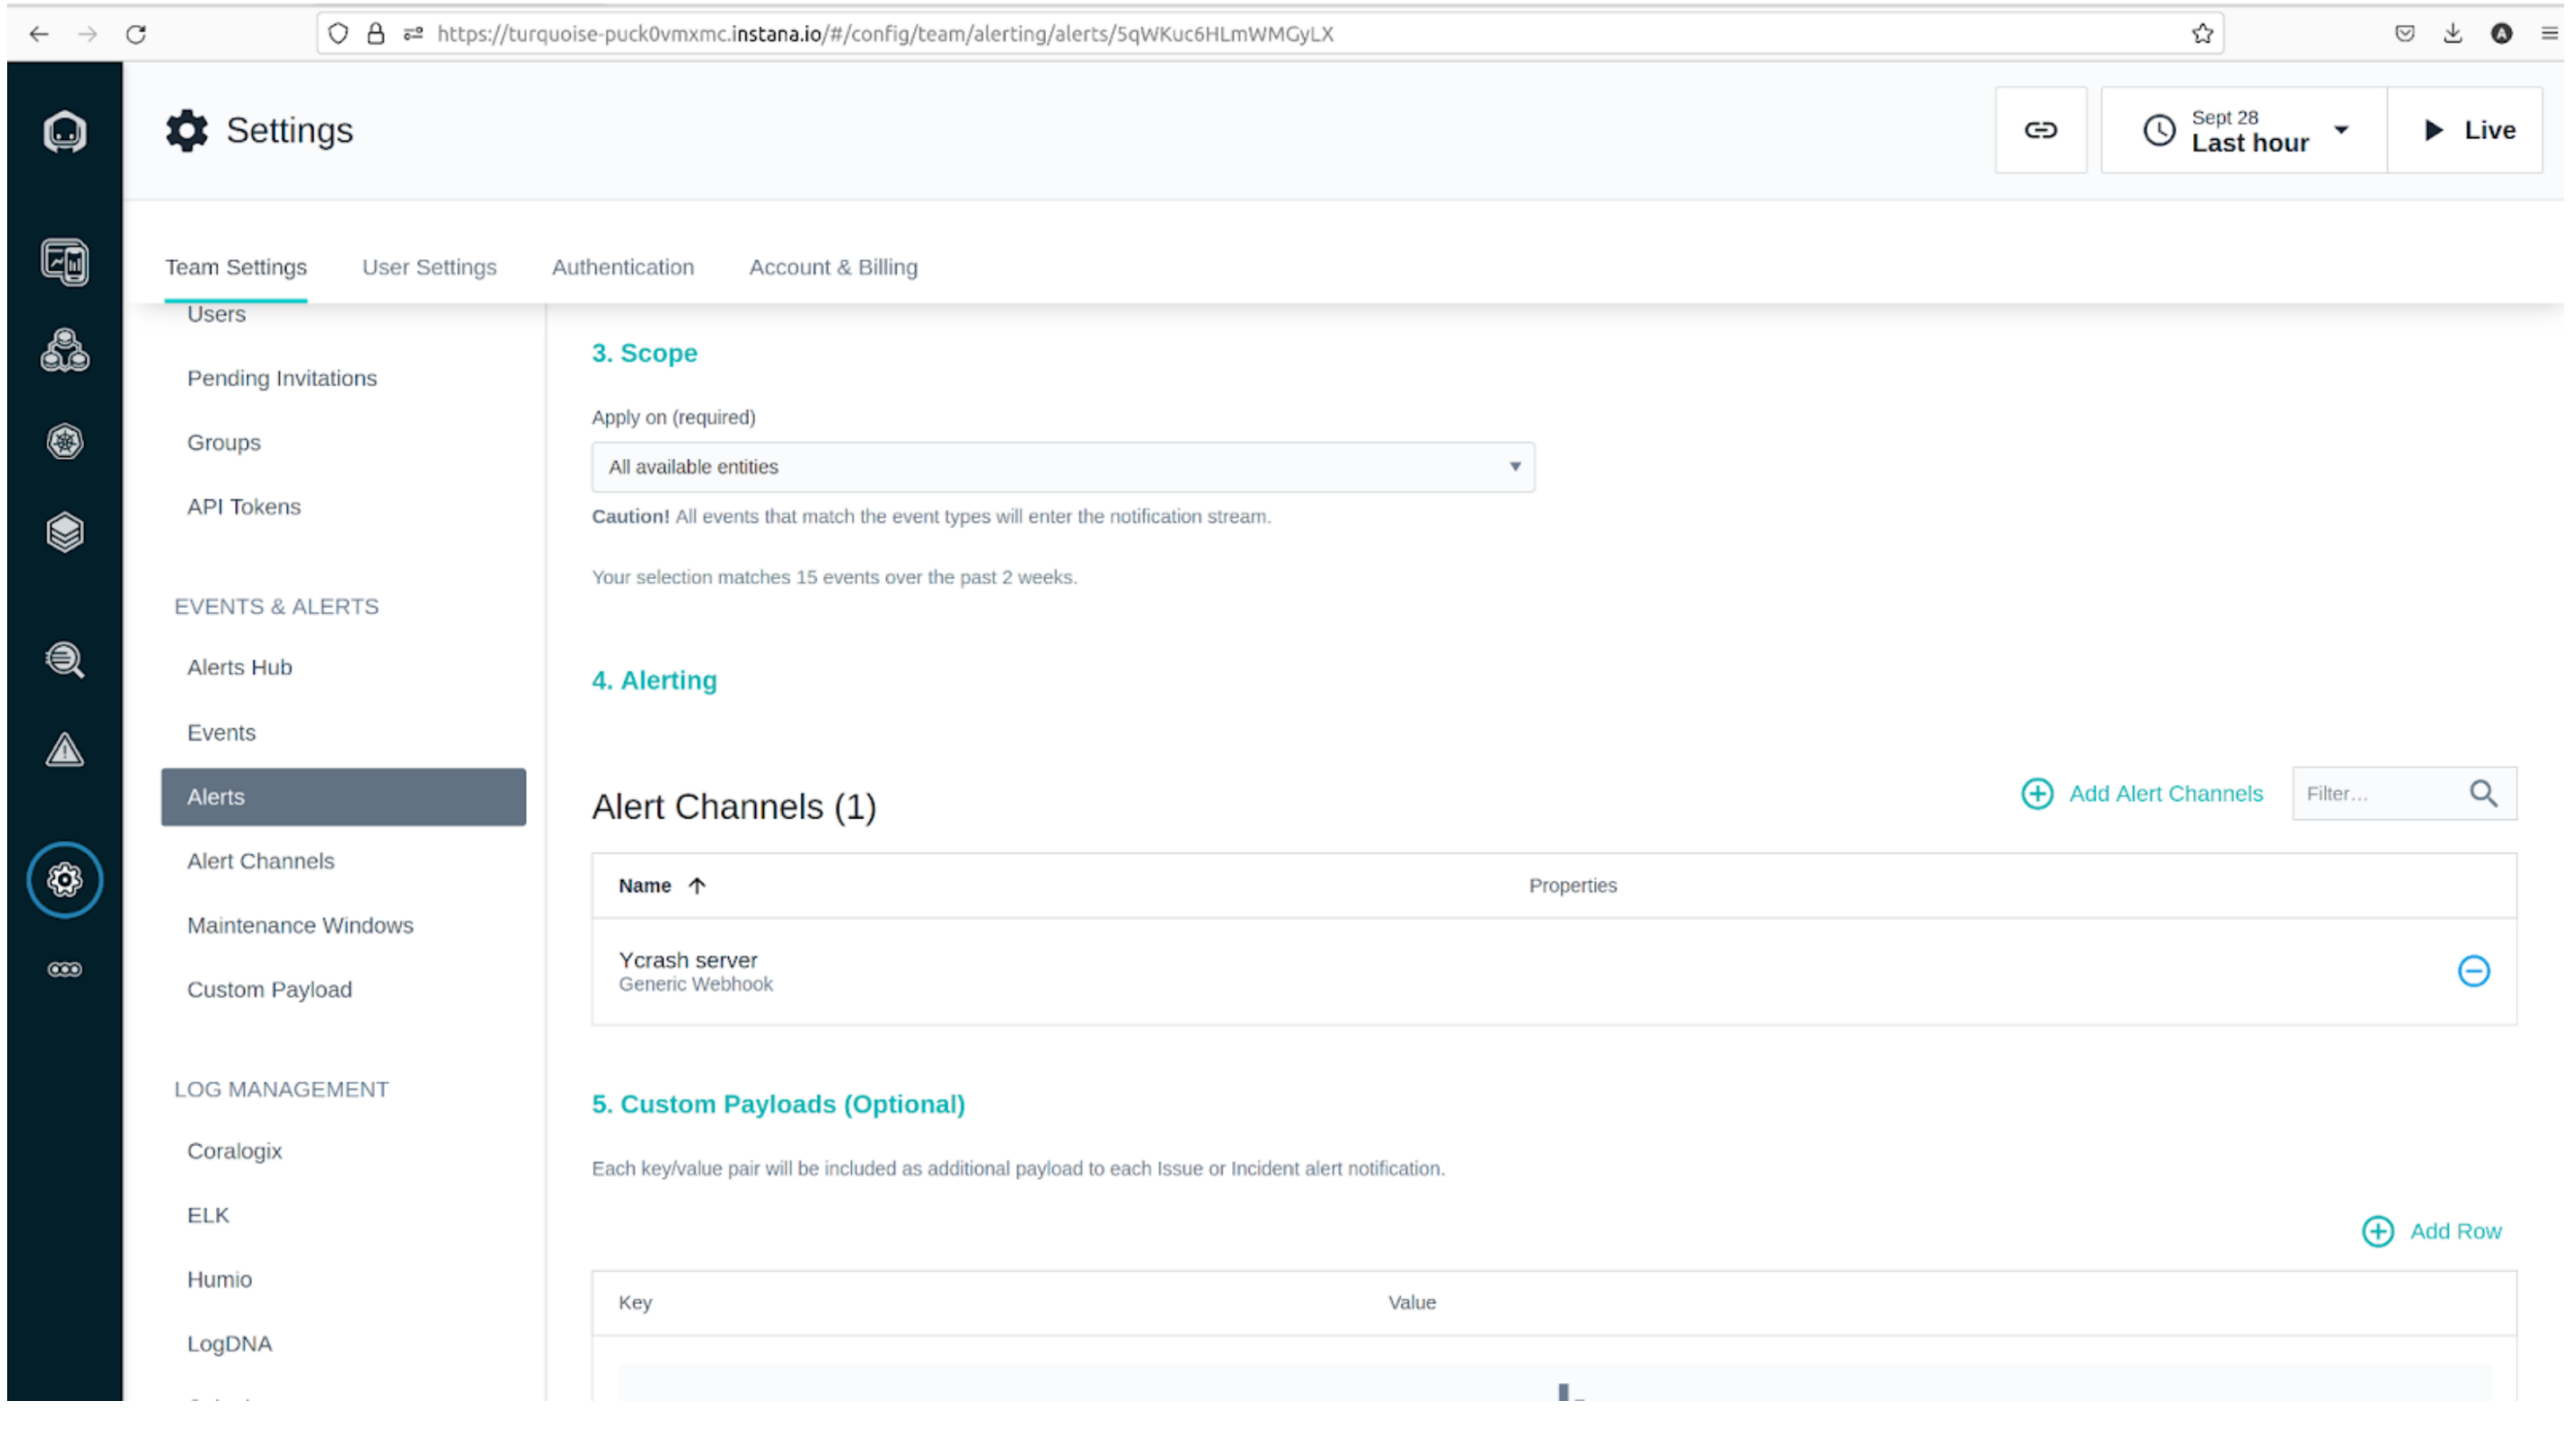
- Now click the "Create" button to create the Alert.
# How to create a custom event for Docker container?
In the below example we will create custom event for CPU usage in Docker container.
- Go to the "Settings" page from the left sidebar.
- From the Settings page go to the "Events" tab and click on the "+ New Event" button.
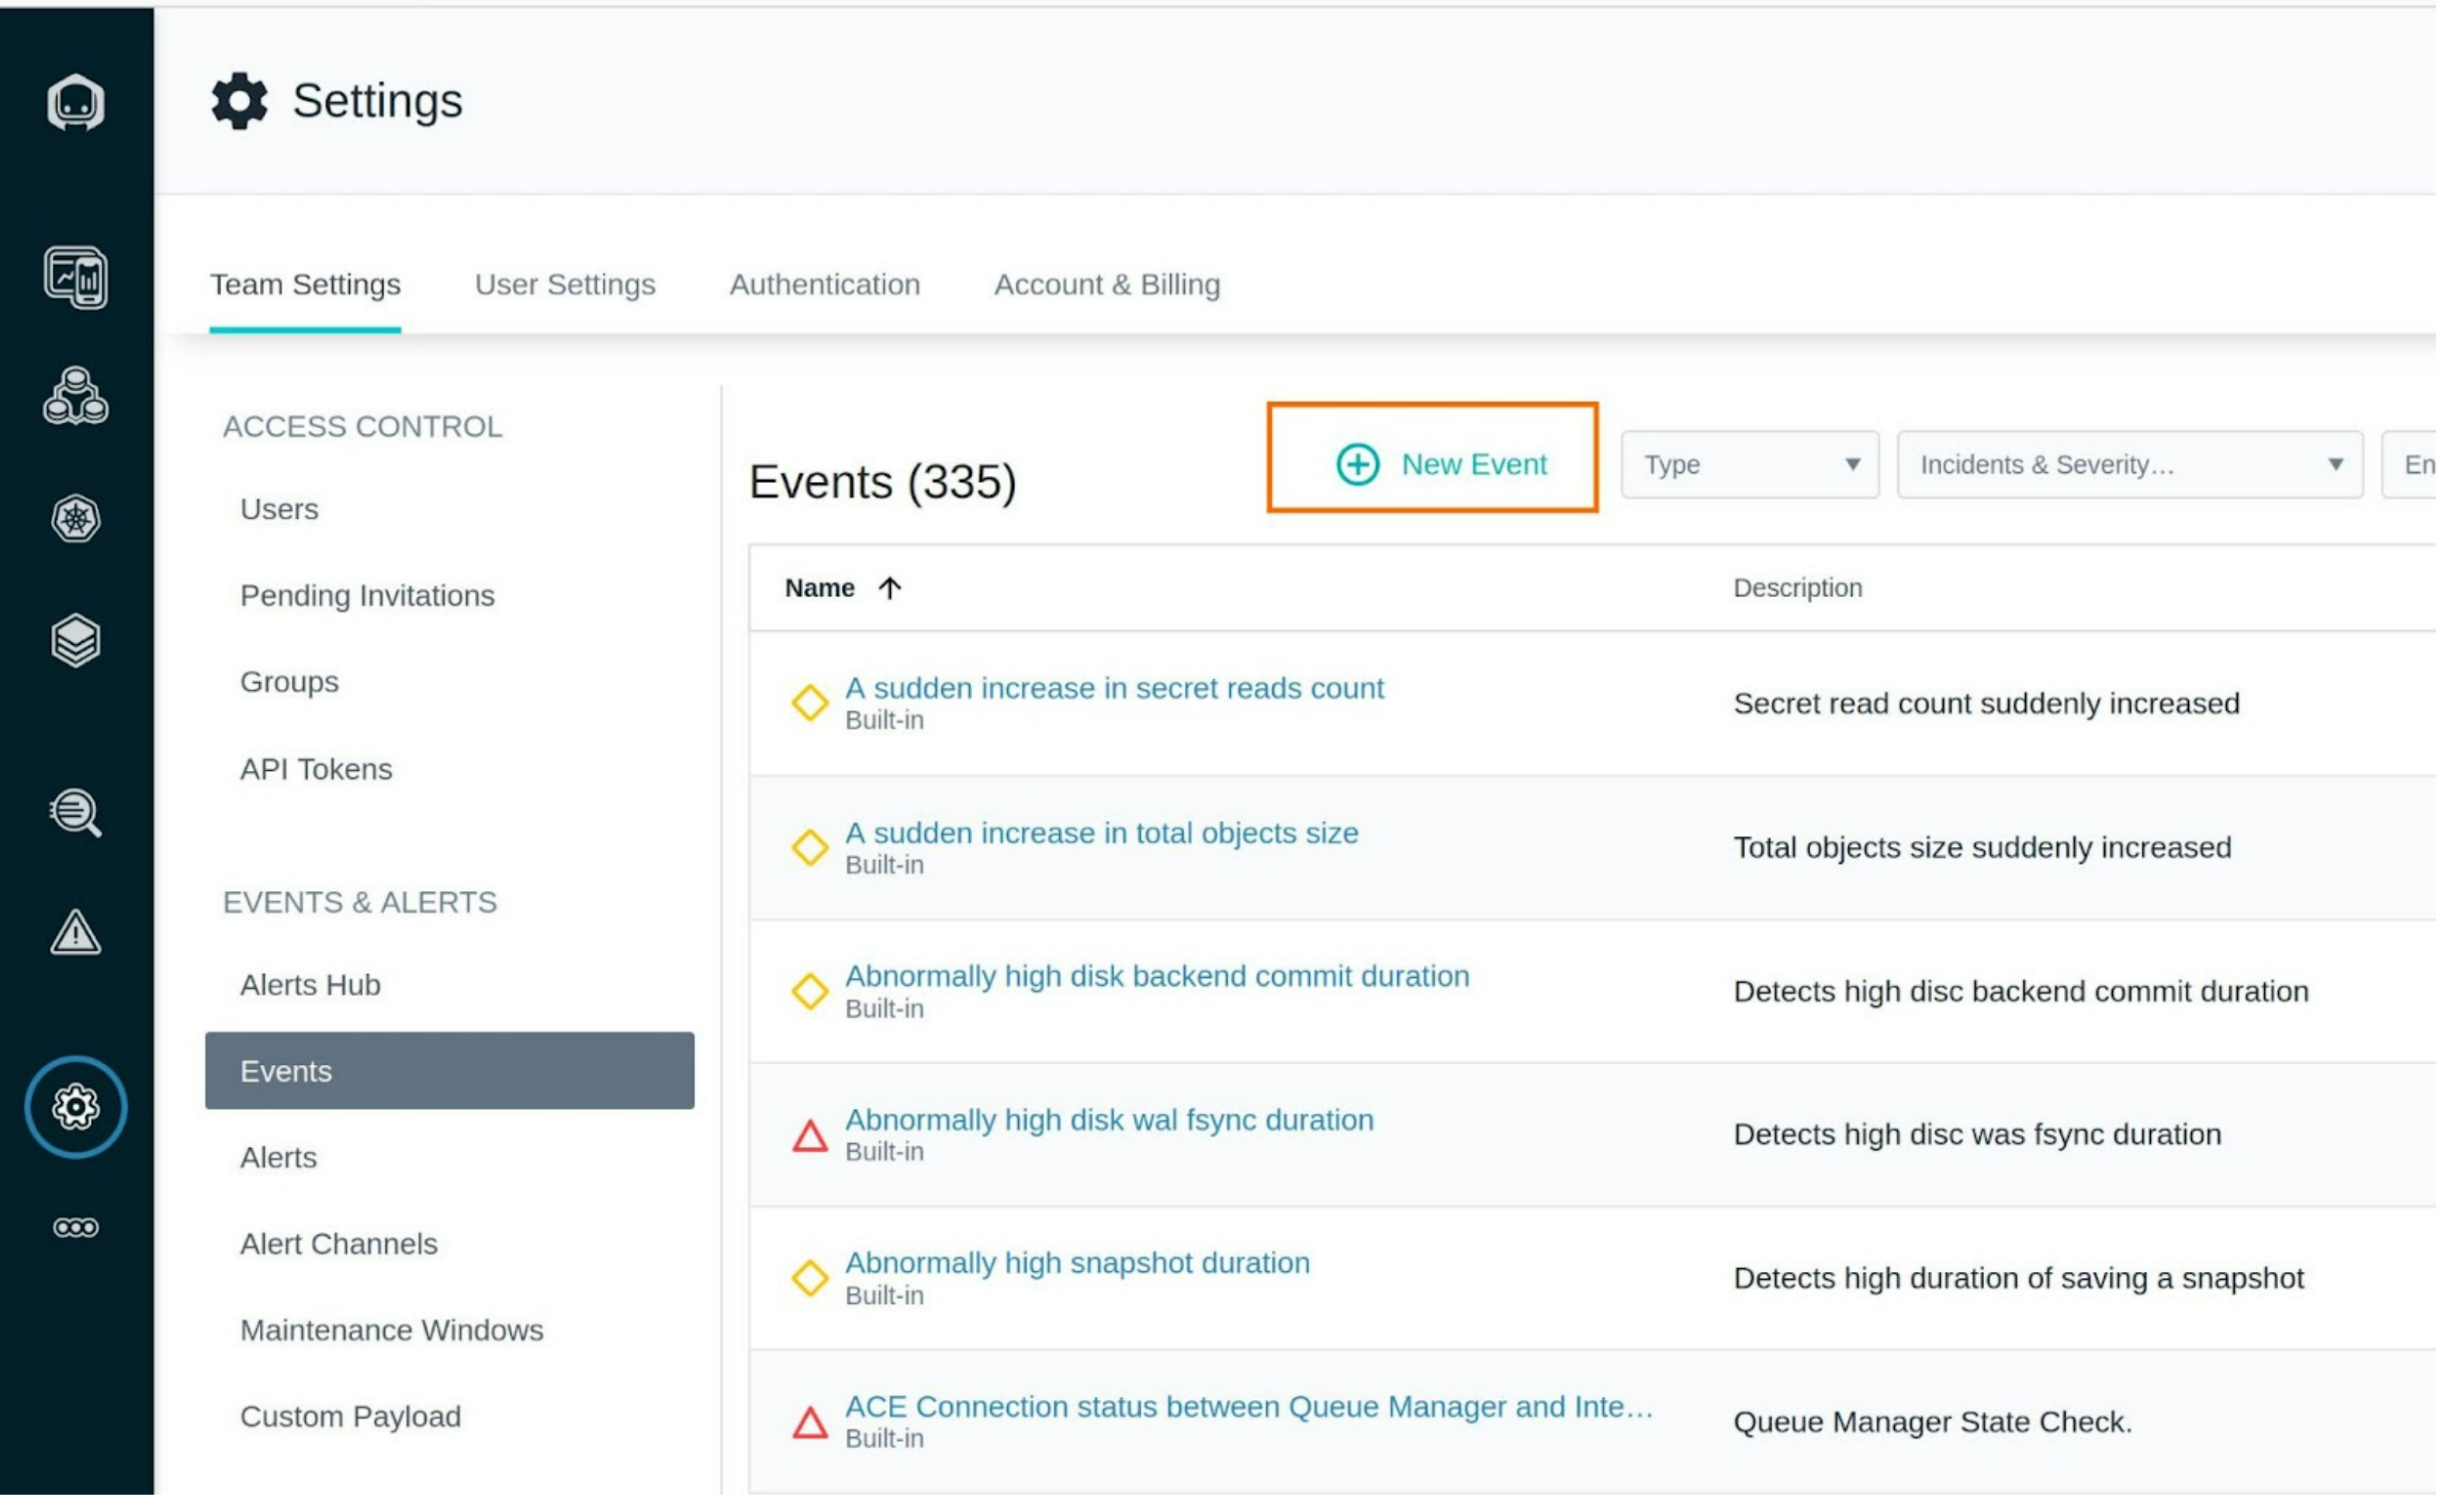
Now fill the form to create a new event:
a. Name: "Docker container CPU usage too high"
b. Description: "Docker container CPU usage too high"
c. Grace period: "5mins"
d. Under Conditions section fill the following details:i. Source: "Built-in metrics"
ii. Metric: "CPU > Total normalized [0, 100]"
iii.Time window: "60s"
iv. Aggregation: "avg"
v. Operator: ">"
vi. Percentage: "80"e. From the "Scope" choose Apply on: "All available entities"
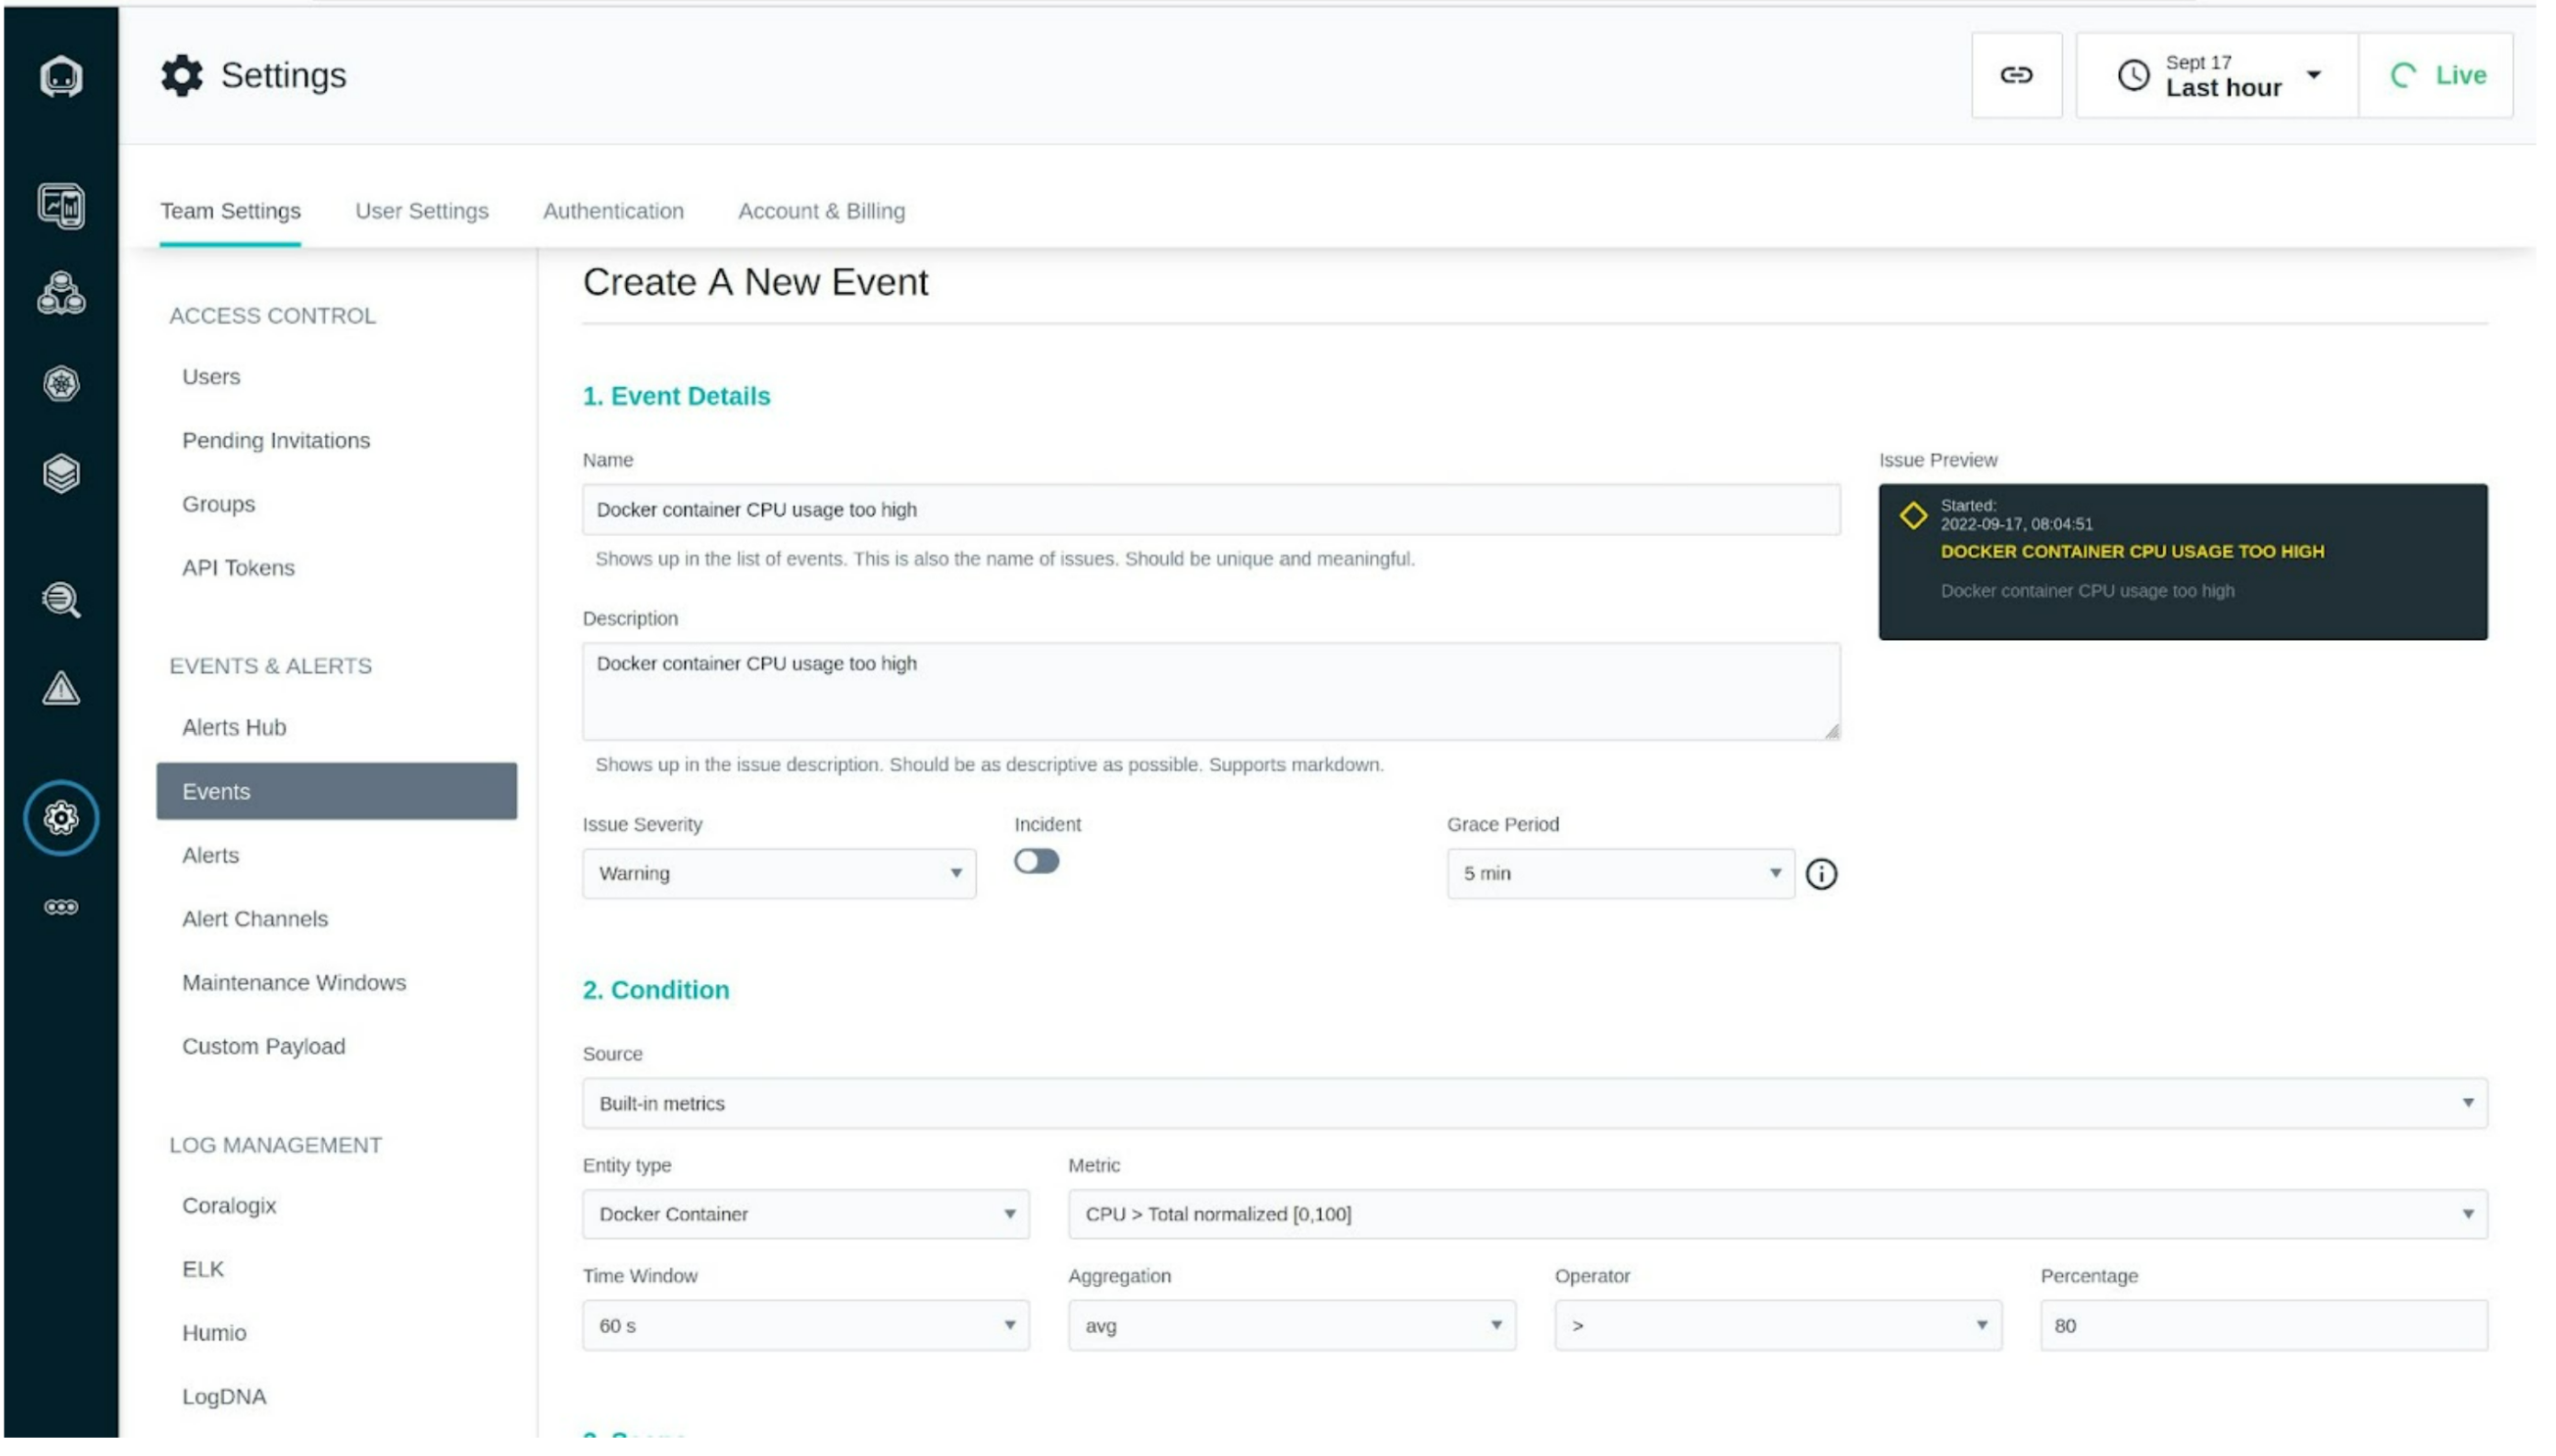
- Next click on the "Create" button to create the custom event.
Now whenever the CPU usage goes beyond 80%, the Instana will generate an alert and it will also invoke the webhook URL that we configured in the first section. The webhook endpoint will further trigger the yc-360 script to capture 16 artifacts from the server where CPU usage went beyond the threshold value.