
# Grafana Integration
# Prerequisites
Install Prometheus (opens new window) and Grafana (opens new window).
# How to configure Grafana to integrate with yCrash?
Open your browser and enter
http://<grafana-host>:3000. Default login username and password is admin.Add new notification channel
a) Click on the "Setup Alerting" menu and select the "Notification Channels" option.
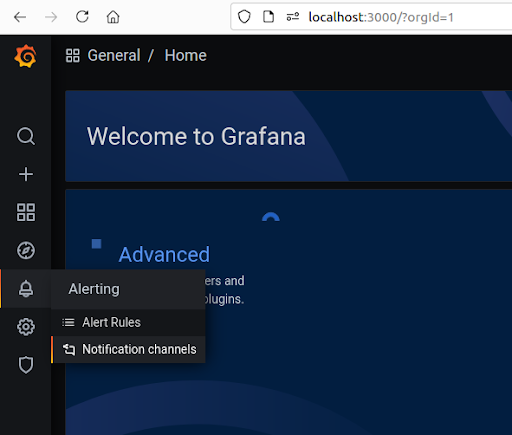
b) Now click on the "Add Channel" button.
c) Select "Webhook" option from the type dropdown.
d) Enter the following URL in the URL textbox - http://ycrash.default.svc:8080/alert-receiver?source=grafana
e) Next click on the save button.
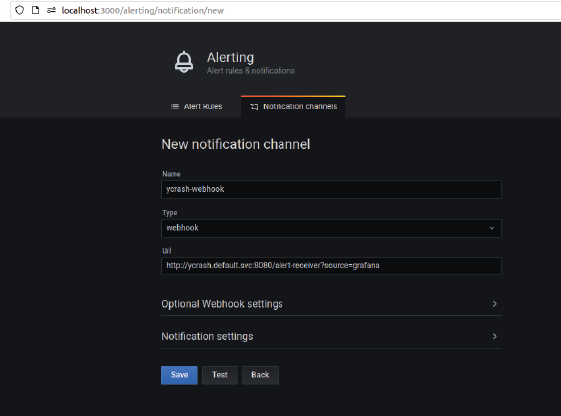
- Create a new Dashboard
a) Click on the "Dashboard" menu and select the "Manage" option.
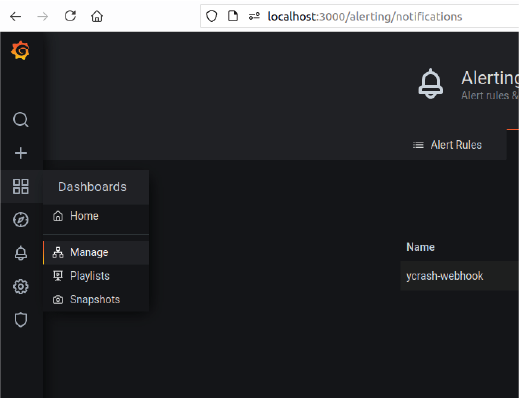
b) Next, click on the "New Dashboard" button
c) Click on the "Add an empty panel" button.
d) Select "Prometheus" as data source.
e) Fill metrics (PromQL query) with the query.
Let's say, you are running an application in Kubernetes and you want to trigger alerts whenever the CPU utilization of alerts goes beyond 80%. In that case, your query will look like this -
80 * (avg by (namespace, pod, container) (rate(container_cpu_usage_seconds_total{namespace="default",name!~".*prometheus.*", image!="", image !~ ".*pause.*", container_name!="POD"}[5m])) / avg by (namespace, pod, container) (container_spec_cpu_quota{namespace="default",name!~".*prometheus.*", image!="", image !~ ".*pause.*", container_name!="POD"} / container_spec_cpu_period{namespace="default",name!~".*prometheus.*", image!="", image !~ ".*pause.*", container_name!="POD"})) + on (namespace, pod) group_left(pod_ip) 0 * kube_pod_info
f) Fill panel title. For example, Container CPU Usage
g) Click on the "save" button and enter the dashboard name.
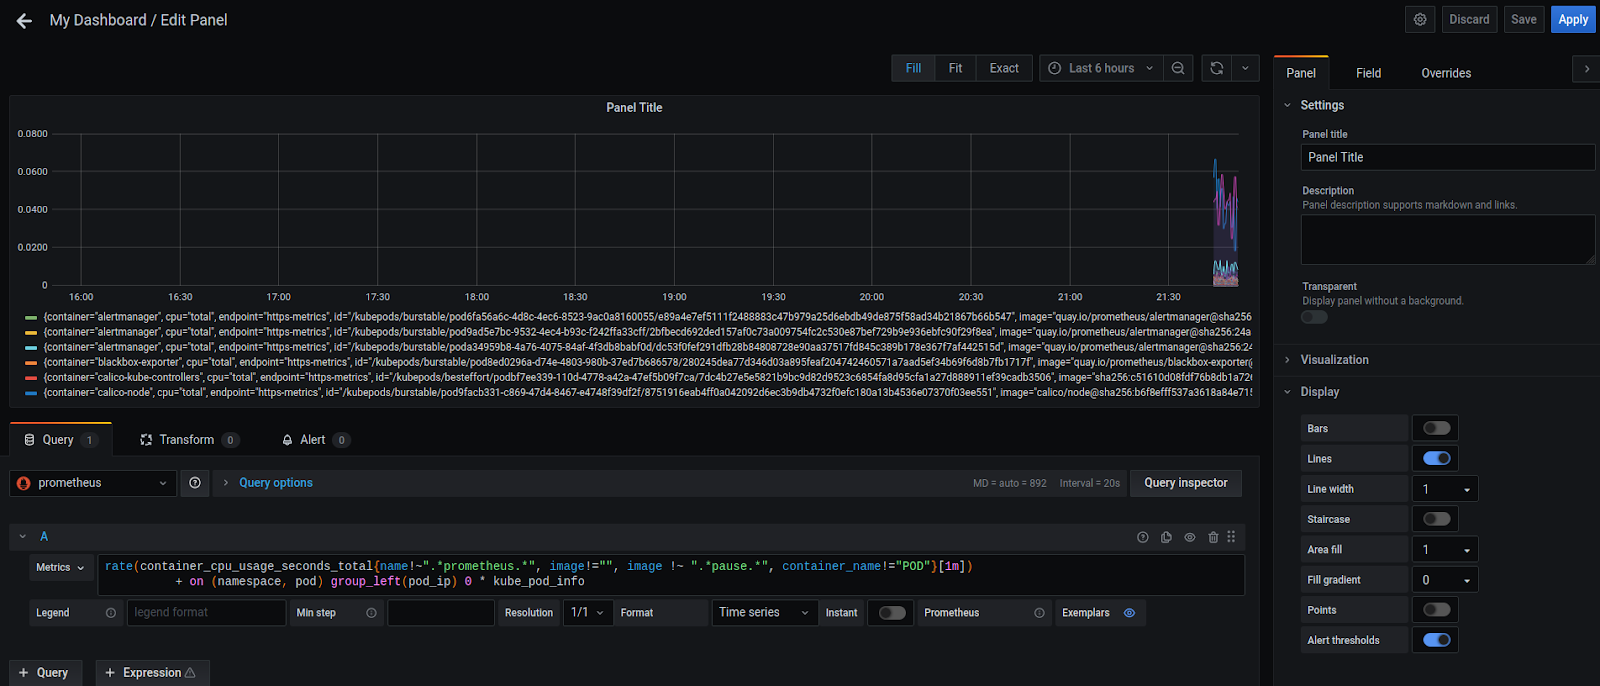
- Edit the dashboard and add alert
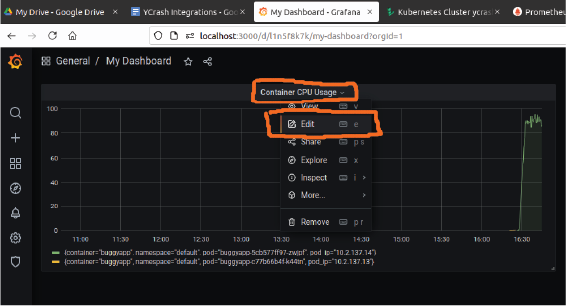
a) Click on "Container CPU Usage" dropdown and select edit option.
b) Click on the "Alert" tab.
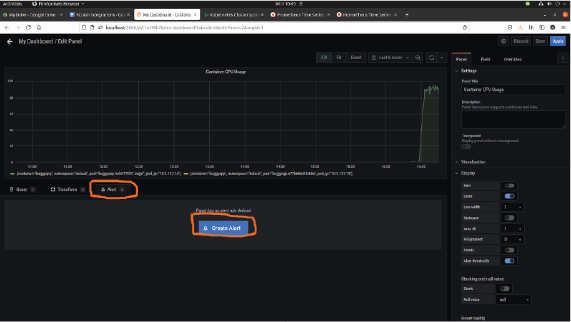
c) Click on the "Create Alert"
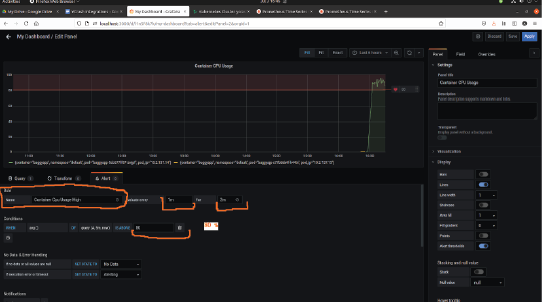
d) Fill rule name. For example, "Container CPU usage high"
e) Evaluate Every: 1m
f) For: 2m
g) Is Above (the threshold): 80
- Configure notifications
a) Add channel "ycrash-webhook" in the "name" field
b) Enter message "CPU usage is high in Pod ${pod} container ${container}." and click on the save button.
Now if you go to menu => Alerting => Alert Rule page then you will see your alert status.
If you are using buggyApp (opens new window) to simulate performance problems then trigger a CPU spike from the buggyApp and wait for 5 minutes. Your alert status will become "firing.
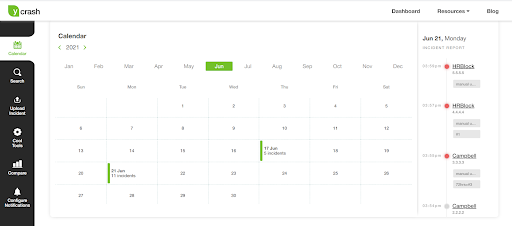
Now go to yCrash calendar dashboard page. You will see incidents on the calendar dashboard.
# Configure monitoring-tools.json file
The monitoring-tools.json file is used to configure the custom properties for the integration with monitoring tools. Inorder to integrate yCrash with Grafana you may want to configure the below 2 properties in monitoring-tools.json file:
ycAgentPort- Configure the port number where your yc-360 script is listening to.ycAgentProtocol- Protocol (http/https) that is configured for the yc-360 script.
By default the value of ycAgentPort will be 8085 and ycAgentProtocol will be https. In case if you don’t configure these properties in the monitoring-tools.json file then the yCrash will use the default values. Here are the steps to configure monitoring-tools.json file:
Create a
monitoring-tools.jsonfile and add the above 2 properties into it.Place this file in the 'upload' directory.
Here is a sample
monitoring-tools.jsonfile.
{
    "ycAgentPort": "8080",
    "ycAgentProtocol": "http"
}
2
3
4
← AppDynamics NewRelic →