
# ELK Stack (Elasticsearch, Logstash, and Kibana) Integration
Elastic APM (opens new window) is a popular open-source application performance monitoring system built on the Elastic Stack. It allows you to monitor your application by collecting detailed performance information from your server. When critical events are taking place on your server, the elastic stack will raise alerts in your Kibana dashboard. yCrash allows customers to integrate elastic alerts with yCrash. The yCrash has exposed a webhook endpoint which will listen to alerts. When the yCrash receives webhook notification, it will capture 360-degree data from the application and display the RCA report.
In this document, you will see how to configure the yCrash webhook endpoint in your Kibana dashboard.
# Setup Metricbeat
Metricbeat is a lightweight agent or shipper that can be installed on your servers to periodically collect various system-level metrics such as CPU or memory or data related to the services running on your server and ships the data to ElasticSearch. Read more about how to use Metricbeat here (opens new window).
# Setup webhook connector in Kibana
Once the Metricbeat is set up, follow the below steps to configure the webhook connector in Kibana.
Login to your elastic stack account https://cloud.elastic.co/login
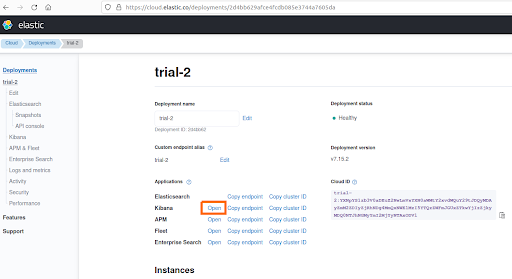
From the home page click on your deployment. It will redirect you to the page where you can see your deployment related information.
Click on the "Open" link displayed in front of "Kibana".
- Click on the "Observability" option on the next page.
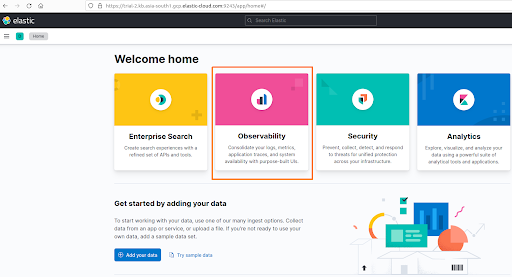
It will take you to the Observability Overview page. In this page click on the "Inventory" menu from the left side navbar.
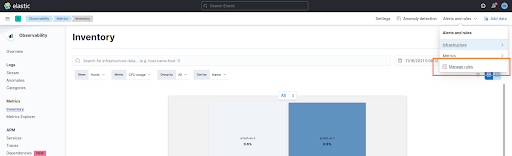
From the "Inventory page", click on the "Alerts and rules" dropdown and choose "Manage rules" option.
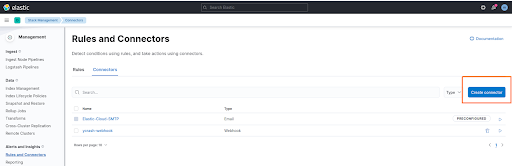
- Go to the "Connector" tab on the next page and click on the "Create Connector" button.
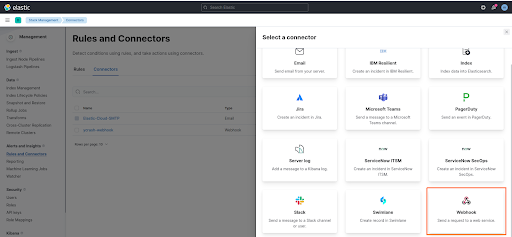
- Next select the "Webhook" connector.
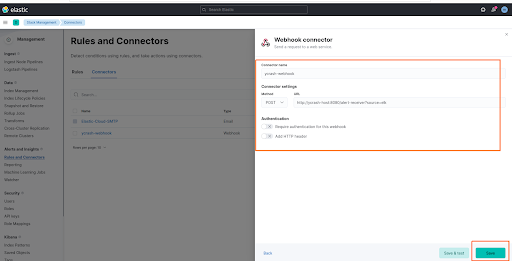
- Now, enter connector name, select POST method and enter yCrash webhook endpoint in the URL
"https://<your-ycrash-server>/alert-receiver?source=elk"field and click on the "Save" button.
# Set up Alerts in Kibana
Follow the below steps to configure alerts in Kibana.
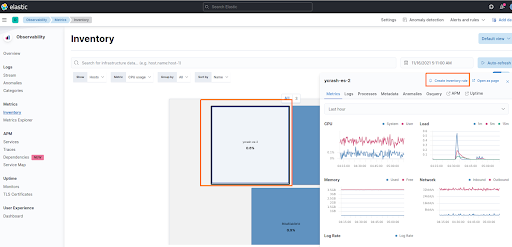
Go to the "Inventory" page. Choose value from the show dropdown to see monitored hosts/containers/pods.
Next click on the host/container/pod where you want to configure alerts.
In the popup click on the "Create inventory rule" button.
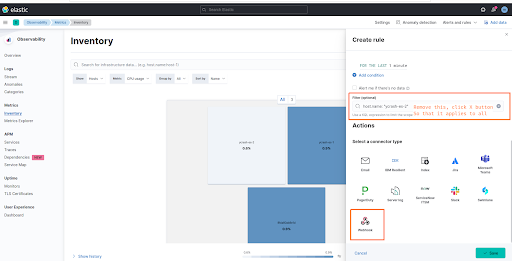
- Click on the "cross" button in the filter textbox so that it applies to all. Next select the "Webhook" connector and click on the "Save" button.
- Now select your webhook connector that we created in the step #9 of "Setup webhook connector in Kibana" section and enter the payload body as shown in the below screenshot.
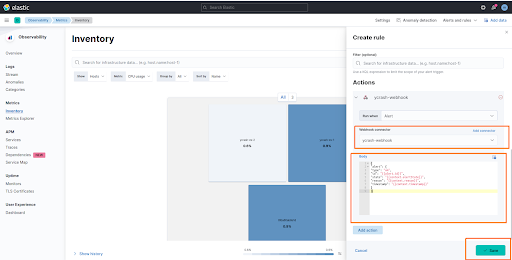
Here is a payload body
{
  "alert": {
  "type": "vm",
  "id": "{{alert.id}}",
  "state": "{{context.alertState}}",
  "reason": "{{context.reason}}",
  "timestamp": "{{context.timestamp}}"
 }
}
2
3
4
5
6
7
8
9
# Configure monitoring-tools.json file
The monitoring-tools.json file is used to configure the custom properties for the integration with monitoring tools. Inorder to integrate yCrash with Elasticsearch you may want to configure the below 4 properties in monitoring-tools.json file:
| Properties | Description |
|---|---|
ycAgentPort | Configure the port number where your yc-360 script is listening to. |
ycAgentProtocol | Protocol (http/https) that is configured for the yc-360 script. |
elkApiUrl | This is a mandatory property used to configure the Elasticsearch API URL. The yCrash will use this API to get the IP address where your target application is running. |
elkAuthToken | This is a mandatory property used to configure the Elasticsearch auth token. The auth token is used by yCrash while calling Elasticsearch api. |
By default the value of ycAgentPort will be 8085 and ycAgentProtocol will be https. In case if you don’t configure these properties in the monitoring-tools.json file then the yCrash will use the default values. Here are the steps to configure monitoring-tools.json file:
Create a
monitoring-tools.jsonfile and add the above 4 properties into it.Place this file in the 'upload' directory.
Here is a sample
monitoring-tools.jsonfile.
{
    "ycAgentPort": "8080",
    "ycAgentProtocol": "http",
    "elkAuthToken": "ZWxhc3RpYzptSThRMN2JIeFV0QXURnUGhUQjgc5RGU3WHo=",
    "elkApiUrl": "https://deployment1.es.asia-southeast1.gcp.elastic-cloud.com:9243"
}
2
3
4
5
6