
# Webhook Notification
Webhook notification allow you to receive real-time incident alerts and data from yCrash Server to a designated endpoint URL. This page will guide you through configuring Webhook notifications and understanding the payload format.
Note
This feature is available only for logs uploaded through the yc-360 script (On-Demand Mode or Micro Metrics Monitoring Mode). It is not supported for manual uploads.
# Configure Webhook Settings
To configure Webhook notification settings in yCrash follow these steps:
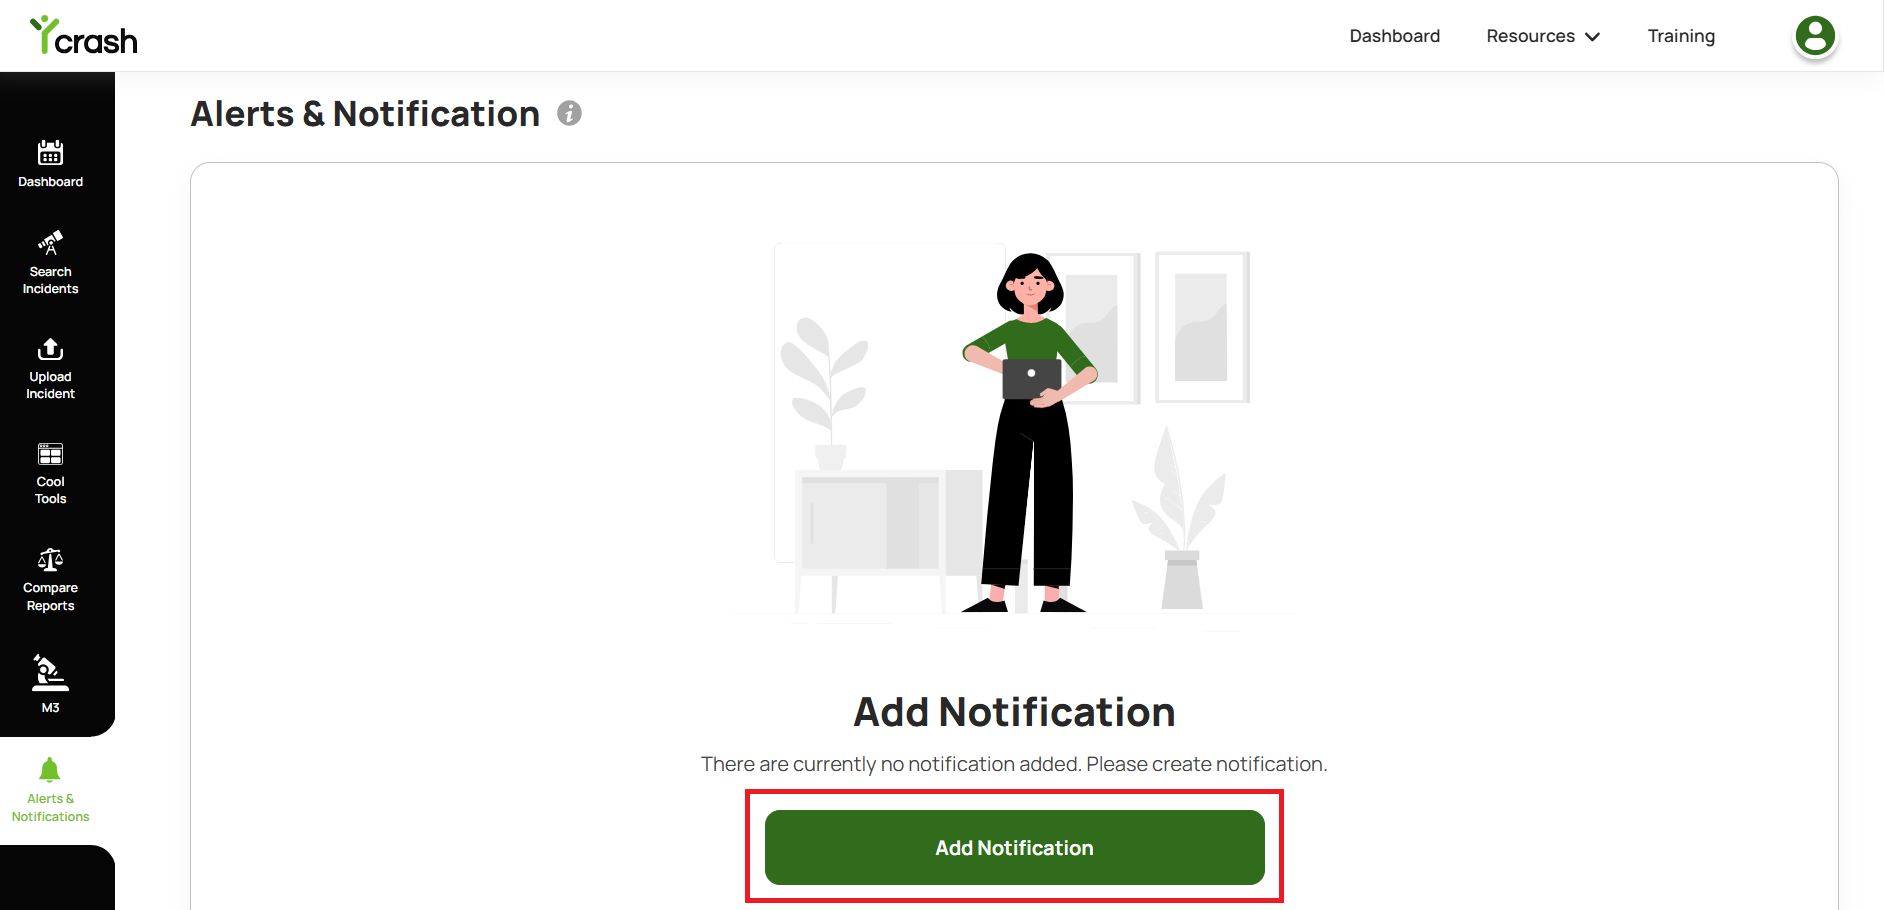
Click on the 'Alerts & Notification' menu item on the left panel on the dashboard.
Click on the 'Add Notification' button.
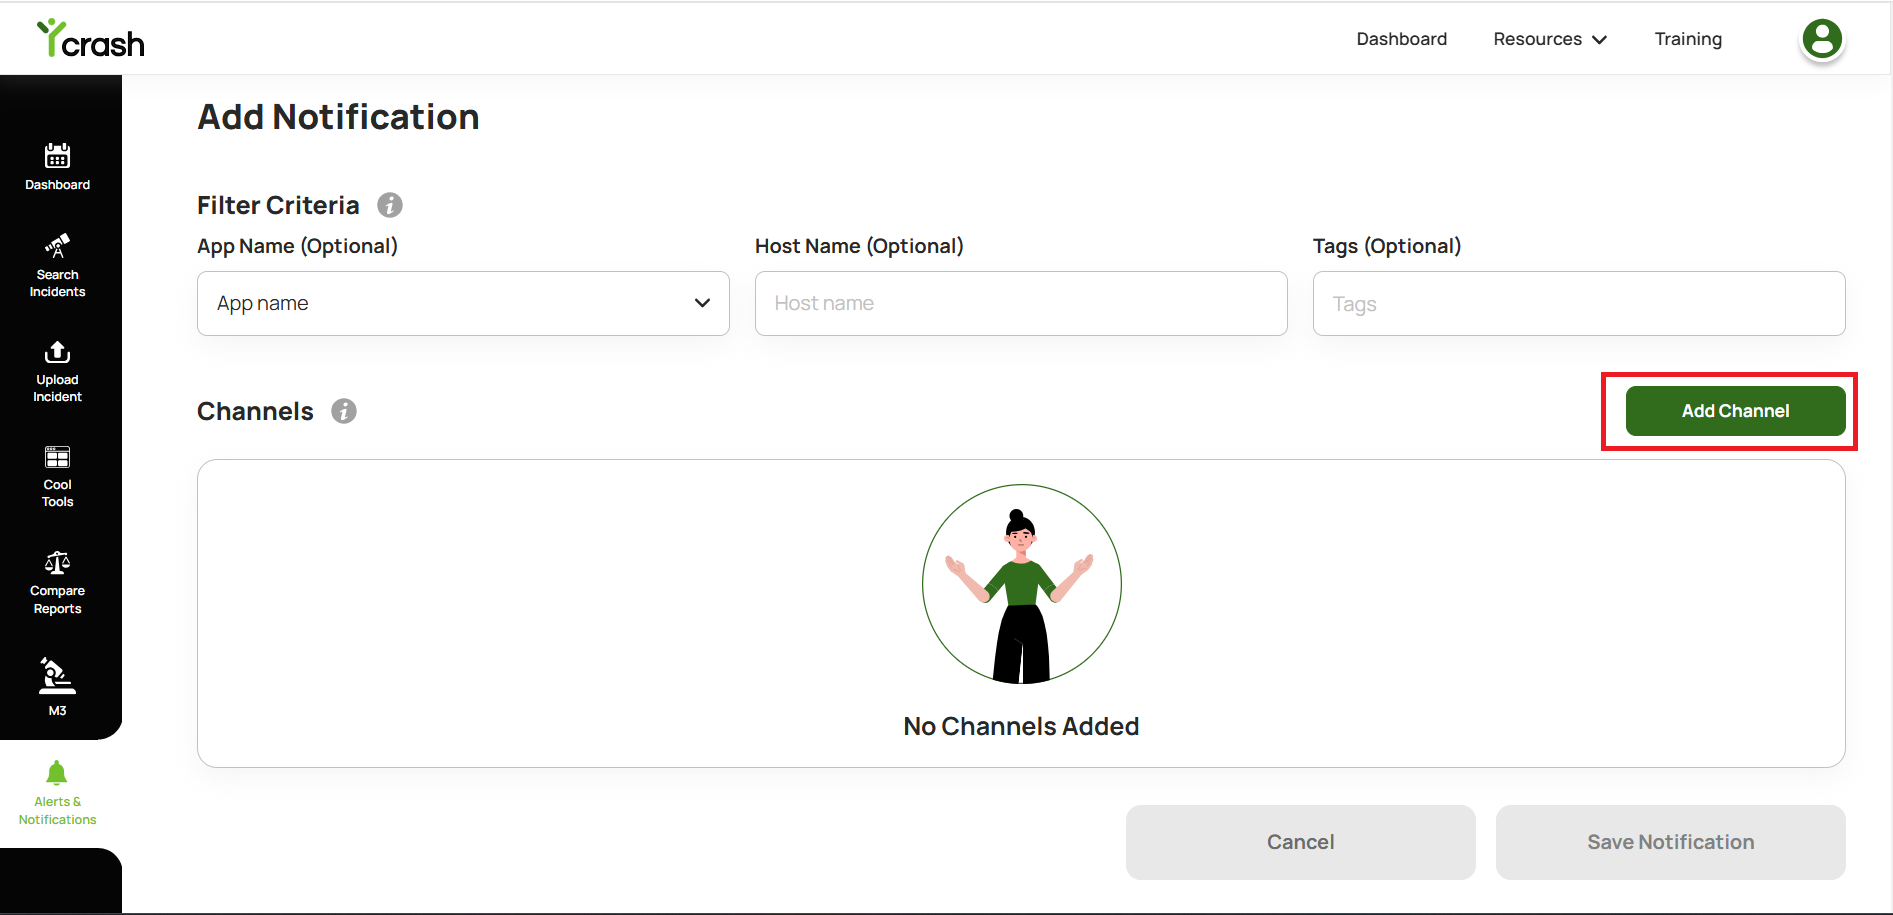
- From the Add Notification page, click 'Add Channel'.
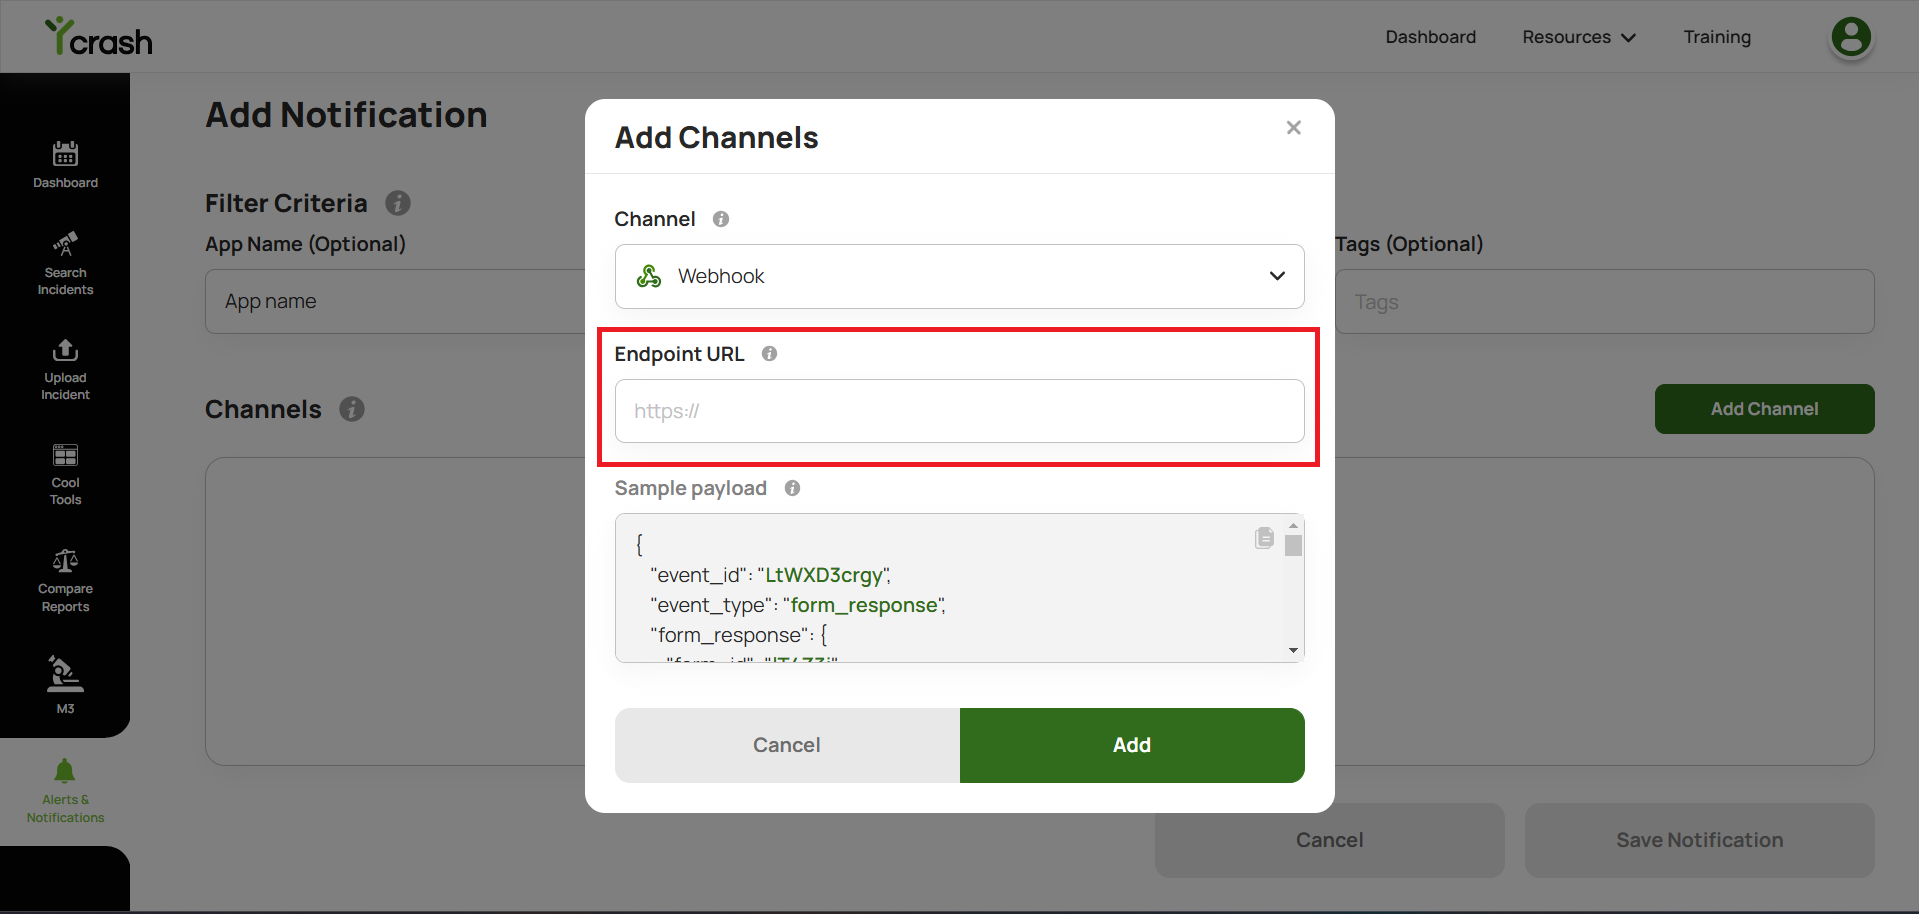
The Add Channel popup will appear. Select Webhook in the channel field.
In the Endpoint URL field, provide the URL where yCrash Server should send Webhook notifications.
Example:
https://example.com/webhook-endpoint (opens new window)
This above URL should be capable of receiving POST requests.
- Click on the Add button and click on the Save Notification button.
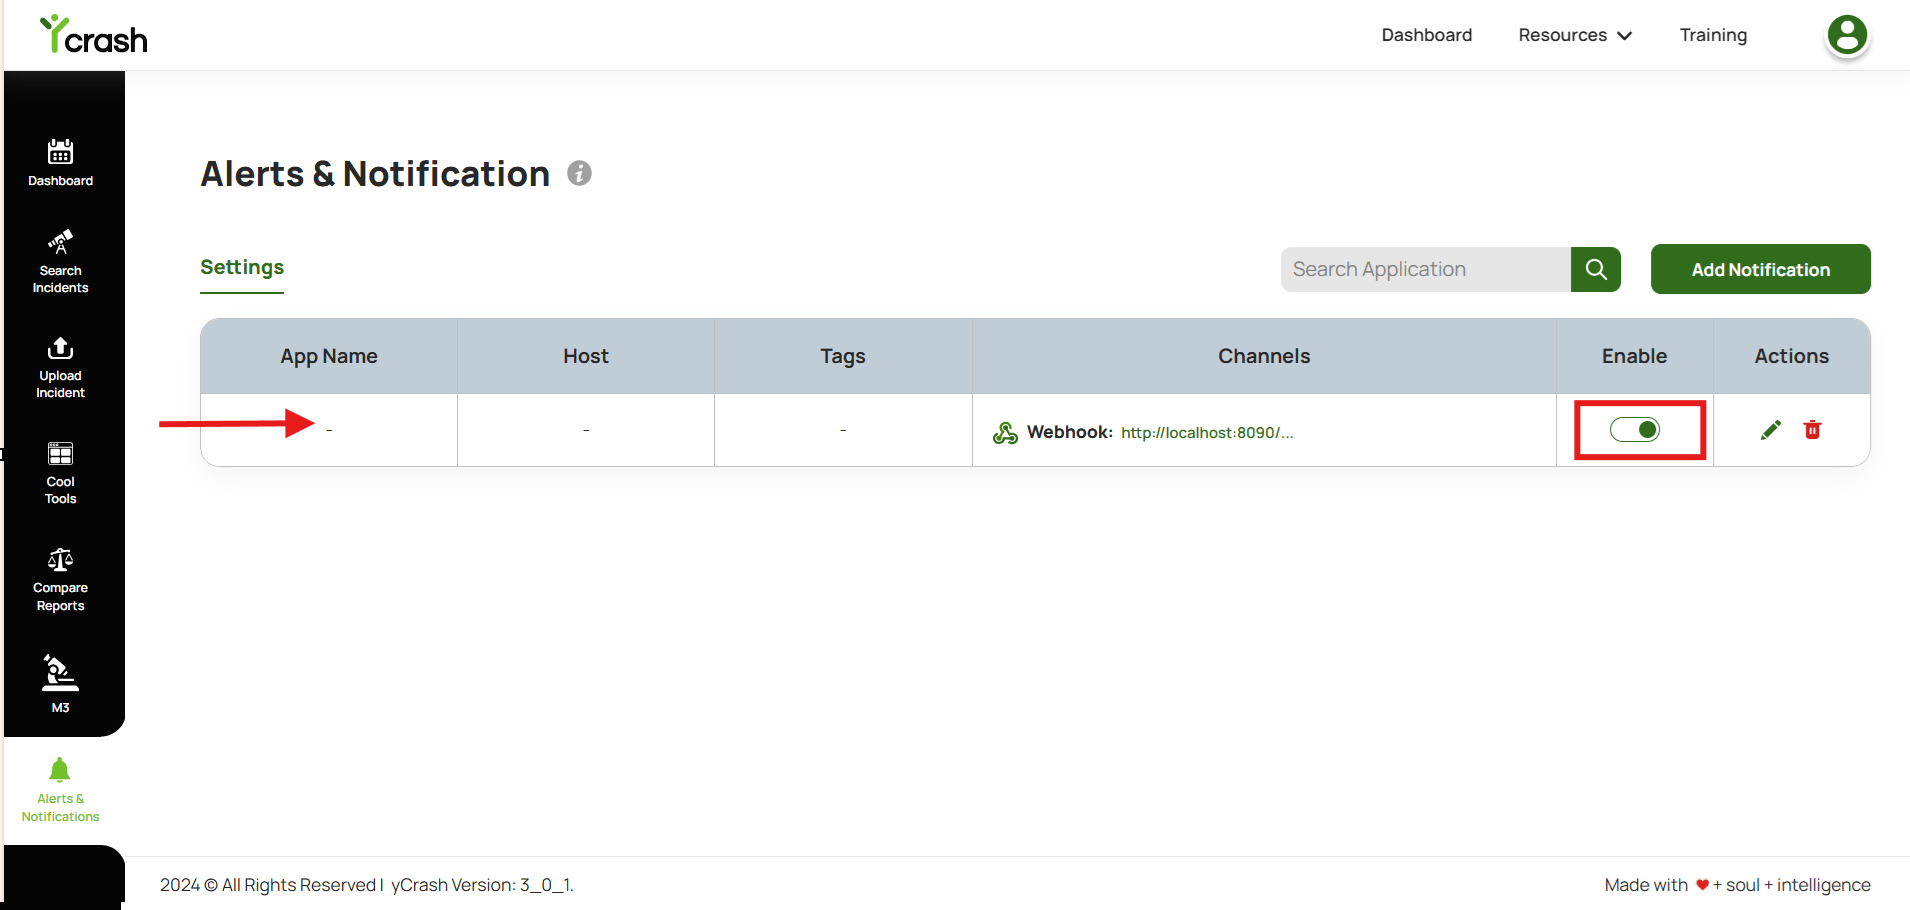
Ensure the created channel is enabled by default. Users are allowed to enable or disable channels as per user’s needs. Additionally, users can edit or delete any created channels..
The steps explained above are for creating channels to send notifications without applying any filters. Alternatively, you can configure rules to notify users only when specific filters, such as App Name (optional), Host Name (optional), or Tags (optional) that are configured, match the incidents. To create a channel with filter criteria please refer to this documentation.
# Payload Format
Webhook notifications will be delivered in the following JSON format:
{
    "device": "101.23.45.65",
    "app": "yc",
    "timeStamp": "01-11-2023T12-23-12",
    "incidentReportURL": "https://example.com/yc-report.jsp?ou=abcdefgh&de=1.1.23.3&app=yc&ts=2023-11-01T12-23-12",
    "memory": "50.0",
    "cpu": "30.0",
    "tags": "yCrash-dev",
    "appIssuesCount": 12,
    "deviceIssuesCount": 2
}
2
3
4
5
6
7
8
9
10
11
In this payload, the following fields are included:
| Property | Description |
|---|---|
device | The IP address of the device where the incident occurred. |
app | The application name associated with the incident. |
timeStamp | The timestamp of the incident. |
incidentReportURL | A URL to access the incident report for further details. |
memory | The memory usage at the time of the incident. |
cpu | The CPU usage at the time of the incident. |
tags | Any tags or labels associated with the incident. |
appIssuesCount | The number of issues related to the application. |
deviceIssuesCount | The number of issues related to the device. |
Please note that, as of now, the payload cannot be customized. However, the ability to customize the payload will be available in a future release of yCrash Server.
# Testing
Before deploying the webhook, make sure to test it to ensure it functions as expected. You can use tools like Postman or curl to simulate incidents and verify that the webhook sends data to the correct endpoint.
Once you have successfully configured and tested the Webhook notifications, your yCrash server will send incident information in real-time to the external system or service whenever an incident occurs.
TIP
Remember to secure your endpoint URL to prevent unauthorized access to the webhook and handle the incoming data appropriately on the receiving end.