
# App Log Analysis API
Our Application Log Analysis REST API delivers in-depth diagnostics to uncover critical issues such as exceptions, time delays, and repeating error patterns. These insights help in proactively identifying stability and performance issues in your application. This API is ideal for teams looking to automate root cause analysis and eliminate hours of manual log inspection.
# How to invoke Application Log analysis API?
Follow the steps below to invoke the Application Log (App Log) API:
EndPoint
Use the following endpoint to invoke the App Log API:
https://<HOST:PORT>/analyze-log-api?apiKey=<YOUR_API_KEY>Replace the placeholders with your actual values:
HOST: Host/IP address where yCrash server is installed.
PORT: Port in which yCrash server is listening.
YOUR_API_KEY: Your API key was provided with your license at the time of registration. If you're not sure where to find the API key, click here (opens new window).
The body of the HTTP request should contain the application log file you want to analyze.
HTTP Response will be sent back in JSON format, containing several key statistics and insights about the uploaded application log. One of the most important elements in the response is isSerious, which indicates whether any serious errors were detected during analysis. If isSerious is set to true, you should inspect the accompanying errorAnalytics section to review detailed information about the critical issues found in the logs.
The JSON response includes the following key data points:
Statements count (log level stats like ERROR, INFO, WARN, etc.)
List of top errors
Time gaps between log entries
Repeating log statements
PII statements (sensitive data patterns)
Custom patterns (user-defined patterns matched in log lines)
Web report URL to view the full visual analysis in a browser
# CURL command
Assuming your application log file is located in "./my-app.log," then CURL command to invoke the API is:
curl -X POST --data-binary @./my-app.log https://api.ycrash.io/analyze-log-api?apiKey={YOUR_API_KEY} --header "Content-Type:text"
It can’t get any more simpler than that? Isn’t it? 🙂
# Compression
Application log files can be large in size. For efficient transmission and processing, it's recommended to compress the log files before uploading.
If you compress the log file (e.g., into .zip format), you need to specify the compression type either in the HTTP header element or as a URL parameter.
Say suppose you are compressing app log file into 'zip' format, then you can invoke the API with HTTP header element
curl -X POST --data-binary @./my-app.zip "https:/<HOST:PORT>/analyze-log-api?apiKey={YOUR_API_KEY}" --header "Content-Type:text" --header "Content-Encoding:zip"
or you can also invoke the API with 'Content-Encoding' element in the URL parameter
curl -X POST --data-binary @./my-app.zip "https://api.ycrash.io/analyze-log-api?apiKey={YOUR_API_KEY}&Content-Encoding=zip" --header "Content-Type:text"
We support following compression formats :
zip, gz, xz, z, lzma, deflate, sz, lz4, zstd, bz2, tar
You may use the one of your choice. Whatever compression format you used for compressing the app log files should be passed in the 'Content-Encoding' element.
Note
Use the option "–data-binary" in the CURL instead of using "–data" option. In "–data" new line breaks will not be preserved in the request. New Line breaks should be preserved for legitimate parsing.
# Other Tools
You can also invoke the API using any web service client tools such as: SOAP UI, Postman Browser Plugin,…..
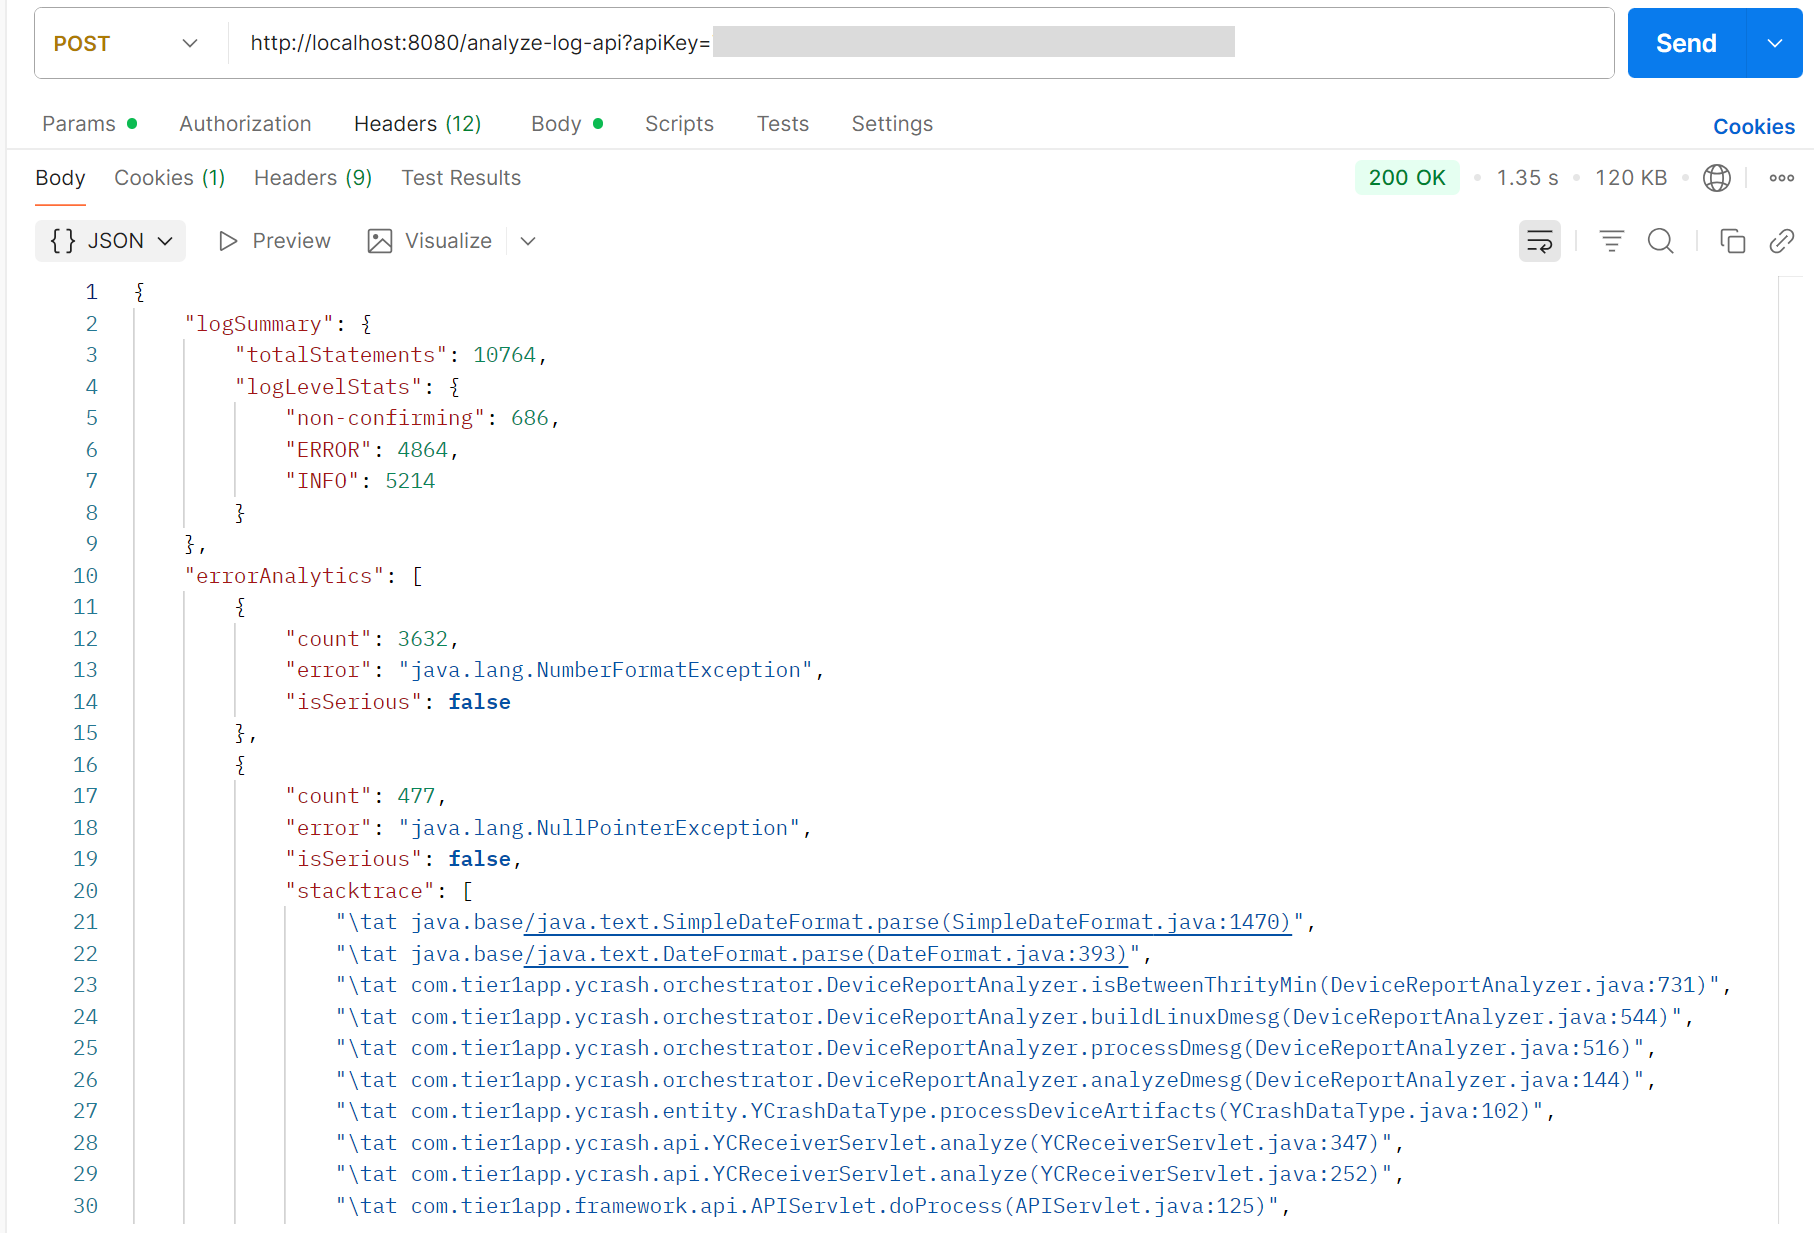
# Sample Response
{
    "logSummary": {
        "totalStatements": 10078,
        "logLevelStats": {
            "non-confirming": 686,
            "ERROR": 4864,
            "INFO": 5214
        }

    },
    "errorAnalytics": [
        {
            "count": 3632,
            "error": "java.lang.NumberFormatException",
            "isSerious": false
        },
        {
            "count": 477,
            "error": "java.lang.NullPointerException",
            "isSerious": false,
            "stacktrace": [
                "\tat java.base/java.text.SimpleDateFormat.parse(SimpleDateFormat.java:1470)",
                "\tat java.base/java.text.DateFormat.parse(DateFormat.java:393)",
                "\tat com.tier1app.ycrash.orchestrator.DeviceReportAnalyzer.isBetweenThrityMin(DeviceReportAnalyzer.java:731)",
                "\tat com.tier1app.ycrash.orchestrator.DeviceReportAnalyzer.buildLinuxDmesg(DeviceReportAnalyzer.java:544)",
                "\tat com.tier1app.ycrash.orchestrator.DeviceReportAnalyzer.processDmesg(DeviceReportAnalyzer.java:516)",
                "\tat com.tier1app.ycrash.orchestrator.DeviceReportAnalyzer.analyzeDmesg(DeviceReportAnalyzer.java:144)",
                "\tat com.tier1app.ycrash.entity.YCrashDataType.processDeviceArtifacts(YCrashDataType.java:102)",
                "\tat com.tier1app.ycrash.api.YCReceiverServlet.analyze(YCReceiverServlet.java:347)",
                "\tat com.tier1app.ycrash.api.YCReceiverServlet.analyze(YCReceiverServlet.java:252)",
                "\tat com.tier1app.framework.api.APIServlet.doProcess(APIServlet.java:125)",
                "\tat com.tier1app.framework.api.APIServlet.doPost(APIServlet.java:68)",
                "\tat javax.servlet.http.HttpServlet.service(HttpServlet.java:681)",
                "\tat javax.servlet.http.HttpServlet.service(HttpServlet.java:764)",
                "\tat org.apache.catalina.core.ApplicationFilterChain.internalDoFilter(ApplicationFilterChain.java:227)",
                "\tat org.apache.catalina.core.ApplicationFilterChain.doFilter(ApplicationFilterChain.java:162)",
                "\tat org.apache.tomcat.websocket.server.WsFilter.doFilter(WsFilter.java:53)",
                ----
            ]
        },
        {
            "count": 310,
            "error": "java.lang.StringIndexOutOfBoundsException",
            "isSerious": false
        },
        {
            "count": 131,
            "error": "java.io.FileNotFoundException",
            "isSerious": false
        },
        {
            "count": 122,
            "error": "java.io.FileNotFoundException: threshold-settings.json (No such file or directory)",
            "isSerious": false,
            "stacktrace": [
                "\tat java.base/java.io.FileInputStream.open0(Native Method)",
                "\tat java.base/java.io.FileInputStream.open(FileInputStream.java:219)",
                "\tat java.base/java.io.FileInputStream.<init>(FileInputStream.java:157)",
                "\tat java.base/java.io.FileInputStream.<init>(FileInputStream.java:112)",
                "\tat com.tier1app.util.FileUtil.loadPropertiesBF(FileUtil.java:422)",
                "\tat com.tier1app.util.ThresholdLoader.loadFromLocalStorage(ThresholdLoader.java:233)",
                "\tat com.tier1app.util.ThresholdLoader.loadThresholdSettingsFromJSON(ThresholdLoader.java:74)",
                "\tat com.tier1app.util.ThresholdLoader.loadThresholdSettings(ThresholdLoader.java:60)",
                "\tat com.tier1app.util.ThresholdLoader.settings(ThresholdLoader.java:35)",
                "\tat com.tier1app.entity.threshold.Threshold.value(Threshold.java:59)",
                "\tat com.tier1app.ycrash.analyzer.DFAnalyzer.findBreaches(DFAnalyzer.java:63)",
                "\tat com.tier1app.ycrash.analyzer.DFAnalyzer.analyze(DFAnalyzer.java:41)",
                ----
            ]
        }
    ],
    "timeGaps": [
        {
            "gapTimeInSeconds": 11220,
            "prevLine": "[2023-06-12 04:58:31,616,  INFO,  c.t.f.s.LCFilter,  ,  ,  ,  Catalina-utility-1,  Session destroyed event invoked.]",
            "currentLine": "[2023-06-12 08:05:32,042,  INFO,  c.t.f.s.LCFilter,  ,  ,  ,  Catalina-utility-1,  Session destroyed event invoked.]"
        },
        {
            "gapTimeInSeconds": 9444,
            "prevLine": "[2023-06-12 01:20:31,120,  INFO,  c.t.f.s.LCFilter,  ,  ,  ,  Catalina-utility-2,  Session destroyed event invoked.]",
            "currentLine": "[2023-06-12 03:57:55,262,  ERROR,  c.t.u.UserErrorUtil,  ,  ,  ,  http-nio-5001-exec-5,  ErrorMsg: Sorry, The Page you are looking for doesn't exist!, Exception: null, status code: 404, error context URL: http:///assets/images/favicon/safari-pinned-tab.svg, another URL: /assets/images/favicon/safari-pinned-tab.svg, heapDump file: null, ERROR]"
        },
        {
            "gapTimeInSeconds": 8857,
            "prevLine": "[2023-06-12 09:57:32,302,  INFO,  c.t.f.s.LCFilter,  ,  ,  ,  Catalina-utility-1,  Session destroyed event invoked.]",
            "currentLine": "[2023-06-12 12:25:10,244,  INFO,  c.t.f.s.LCFilter,  ,  ,  ,  main,  adding uploadDirectory to classpath]"
        },
        {
            "gapTimeInSeconds": 6060,
            "prevLine": "[2023-06-12 08:16:32,068,  INFO,  c.t.f.s.LCFilter,  ,  ,  ,  Catalina-utility-2,  Session destroyed event invoked.]",
            "currentLine": "[2023-06-12 09:57:32,302,  INFO,  c.t.f.s.LCFilter,  ,  ,  ,  Catalina-utility-1,  Session destroyed event invoked.]"
        },
        {
            "gapTimeInSeconds": 3636,
            "prevLine": "[2023-06-12 03:57:55,262,  ERROR,  c.t.u.UserErrorUtil,  ,  ,  ,  http-nio-5001-exec-5,  Incident Id is: 202361235755_19, status code: 404]",
            "currentLine": "[2023-06-12 04:58:31,616,  INFO,  c.t.f.s.LCFilter,  ,  ,  ,  Catalina-utility-1,  Session destroyed event invoked.]"
        }
    ],
    "repeatingPatterns": [
        {
            "count": 3843,
            "statement": "\tat org.apache.catalina.core.ApplicationFilterChain.doFilter(ApplicationFilterChain.java:162)"
        },
        {
            "count": 3200,
            "statement": "\tat org.apache.catalina.core.ApplicationFilterChain.internalDoFilter(ApplicationFilterChain.java:189)"
        },
        {
            "count": 1816,
            "statement": " Failed to retrieve defined_classes, because of: java.lang.NumberFormatException"
        },
        {
            "count": 1816,
            "statement": " Failed to retrieve allocated, because of: java.lang.NumberFormatException"
        },
        {
            "count": 691,
            "statement": "\tat javax.servlet.http.HttpServlet.service(HttpServlet.java:764)"
        }
    ],
    "piiStatements": [
        {
            "count": 14,
            "statement": " Old hd-analysis-tracker file path - /home/ubuntu/apps/5001-yc-server-jdk11/./ycrash/Testing/2023/06/12/{IP_ADDRESS}/yc/16-04-32/hd-analysis-in-progress.txt"
        },
        {
            "count": 14,
            "statement": " New hd-analysis-tracker file path - /home/ubuntu/apps/5001-yc-server-jdk11/./ycrash/Testing/2023/06/12/{IP_ADDRESS}/yc/16-04-32/hd/hd-analysis-in-progress.txt"
        },
        {
            "count": 13,
            "statement": " /home/ubuntu/apps/5001-yc-server-jdk11/./ycrash/Testing/2023/06/12/{IP_ADDRESS}/yc/16-04-32/hd/superpower/hd-api-response.json doesn't exist!"
        },
        {
            "count": 13,
            "statement": " The hd-metadata.json content from local disk - [{\"indexFileCount\":0,\"fileName\":\"{IP_ADDRESS}-16-04-32-yc-yc.bin.phd\",\"isCompressedFile\":true,\"displayName\":\"{IP_ADDRESS}-16-04-32-yc-yc.bin.zip\",\"compressedFileName\":\"{IP_ADDRESS}-16-04-32-yc-yc.bin.zip\",\"isEATParse\":false,\"isSuperPowerParse\":true}]"
        },
        {
            "count": 8,
            "statement": " writing in to /home/ubuntu/apps/5001-yc-server-jdk11/./ycrash/Testing/2023/06/12/{IP_ADDRESS}-80-attendance-registry.txt, list: {IP_ADDRESS}"
        }
    ],
	"myPattern": [
        {
            "count": 4,
            "matchingPattern": " Failed to find UserLicenseLimitType from text:"
        }
    ],
    "webReport": "http://localhost:8080/yc-report-applog.jsp?ou=Testing&de=192.167.1.9&app=yc&ts=2025-08-09T13-42-46&fileName=e0a76f1e-2581-44a7-bcb6-235ea80807d7"
}
2
3
4
5
6
7
8
9
10
11
12
13
14
15
16
17
18
19
20
21
22
23
24
25
26
27
28
29
30
31
32
33
34
35
36
37
38
39
40
41
42
43
44
45
46
47
48
49
50
51
52
53
54
55
56
57
58
59
60
61
62
63
64
65
66
67
68
69
70
71
72
73
74
75
76
77
78
79
80
81
82
83
84
85
86
87
88
89
90
91
92
93
94
95
96
97
98
99
100
101
102
103
104
105
106
107
108
109
110
111
112
113
114
115
116
117
118
119
120
121
122
123
124
125
126
127
128
129
130
131
132
133
134
135
136
137
138
139
140
141
142
143
144
145
146
147
148
149
150
151
# JSON Response Elements
| Element | Description |
|---|---|
| webReport | Hyperlink to open the full visual analysis report in the browser. |
| >logSummary | Contains high-level stats about the log, which includes total number of log lines & total number of error statements appeared in log. |
| totalStatements | Total number of log lines parsed. |
| logLevelStats | Displays counts of each log level (e.g., ERROR, INFO, WARN, non-confirming). Helps assess log severity distribution. |
| errorStatements | Number of log lines that contain errors. |
| >errorAnalytics | List of top error messages detected in the log file along with their frequency and severity. |
| count | Number of occurrences of each error statement. |
| error | It displays the error statement found in logs. |
| isSerious | 'true' is returned if any serious errors are found. 'false' is returned if no serious errors are found. |
| >timeGaps | It Lists delays (in seconds) between consecutive log lines that may indicate performance issues or bottlenecks |
| gapTimeInSeconds | Time gap detected between the two log lines. |
| prevLine | The log entry that appears immediately before the time gap. It represents the last recorded event before a delay in log activity. |
| currentLine | The log entry that appears immediately after the time gap. It indicates the first event following the pause or delay in the logs. |
| >repeatingPatterns | Displays frequently repeating log statements, which may signal excessive logging or loop-related issues. |
| count | Number of times the log statement was repeated. |
| statement | The log message that was repeated. |
| >piiStatements | Displays detected sensitive data in logs by masking it (e.g., {IP_address}, {email}). |
| count | Number of PII (Personally Identifiable Information) data detected in each log statement. |
| statement | It shows the log statements where PII (Personally Identifiable Information) data was detected. |
| >myPattern | 'My Patterns’ allows you to create and manage custom log patterns to filter logs efficiently. If a pattern you've added on the "Manage My Patterns" page matches any log statement, it will be displayed under "My Patterns" when viewing logs |
| count | Displays the number of log entries that match your pattern. |
| matchingPattern | It displays the log statement matching your custom pattern. |