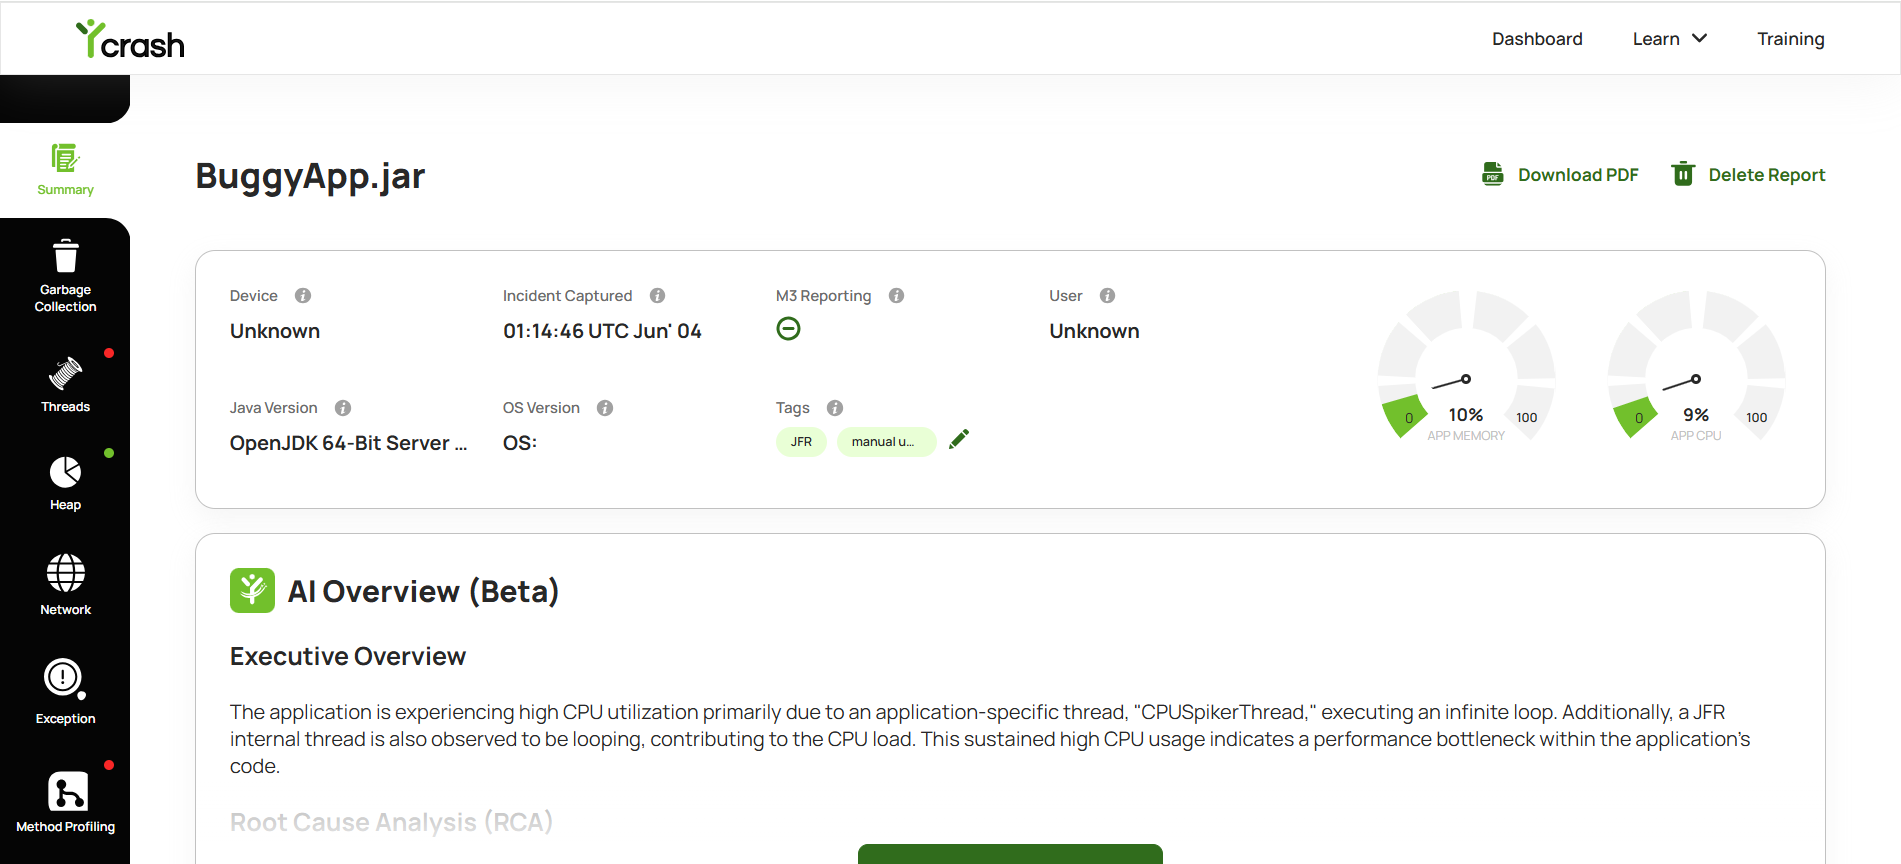
# Java Flight Recorder (JFR) Analysis
yCrash analyzes JFR recordings and automatically identifies performance bottlenecks, highlights potential root causes, and generates actionable recommendations to help you troubleshoot production issues more efficiently.
# Upload a JFR Recording
You can upload a JFR recording directly from the Dashboard.
Step 1: Open the Dashboard
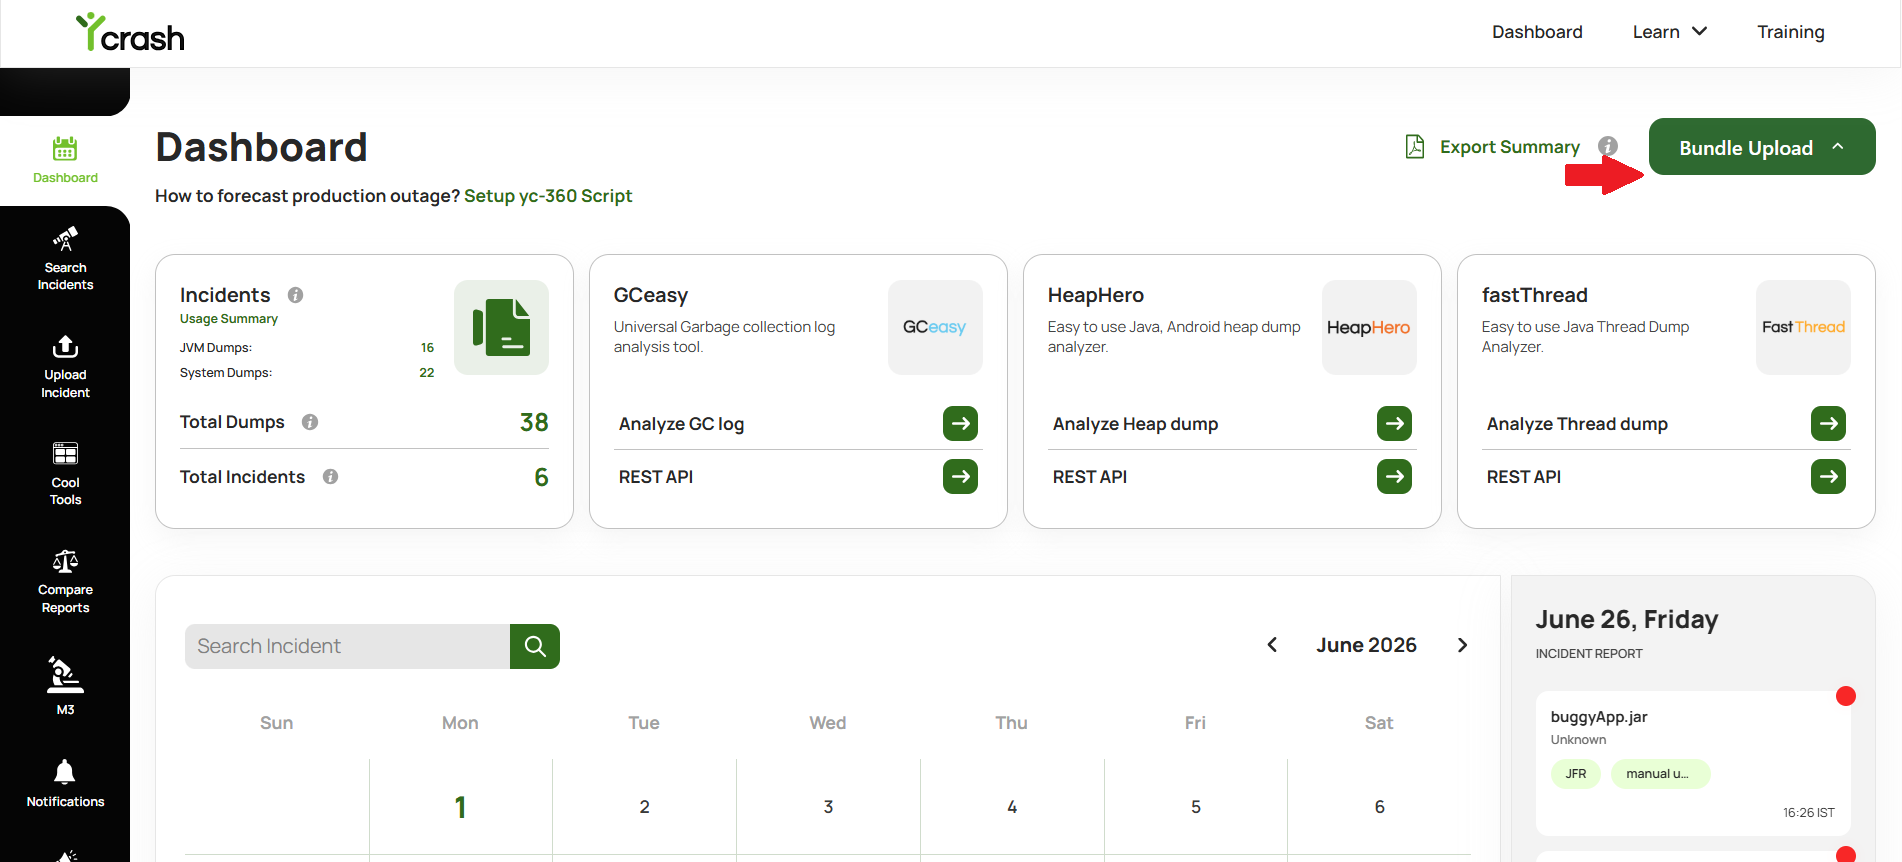
Step 2: Click the Bundle Upload button available on the Dashboard.
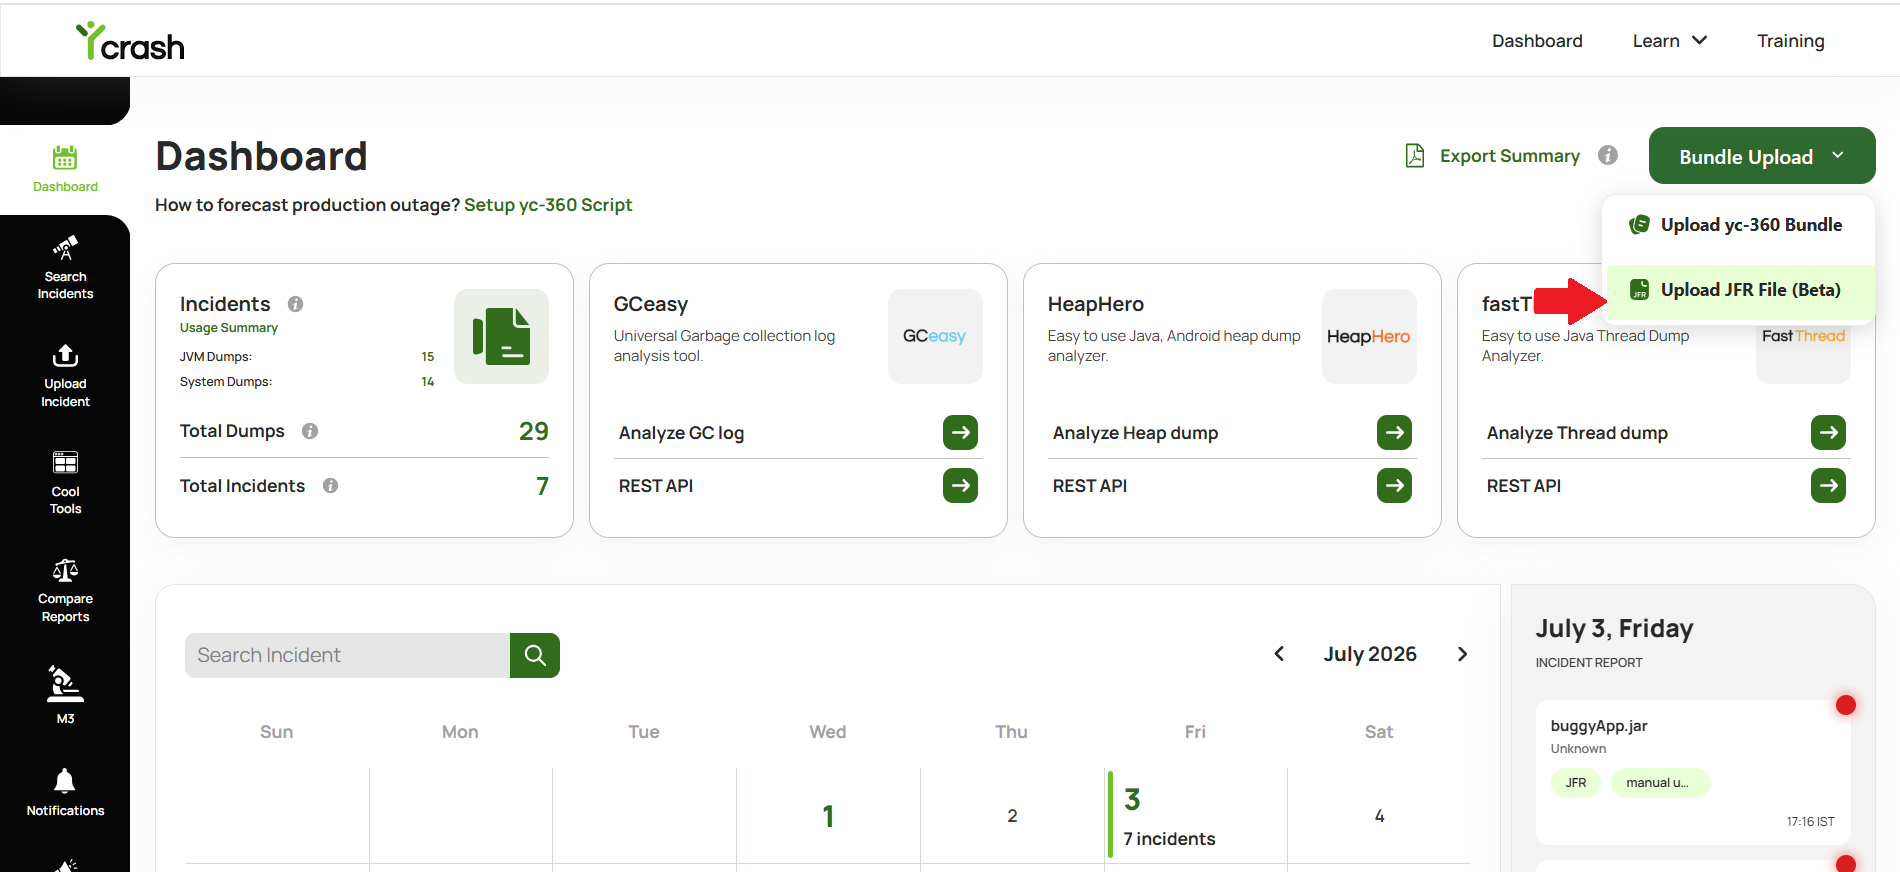
Step 3: Select Upload JFR File option
Step 4: Select the .jfr or .zip file you have.
Tags (Optional) – Specify tags for your future reference.
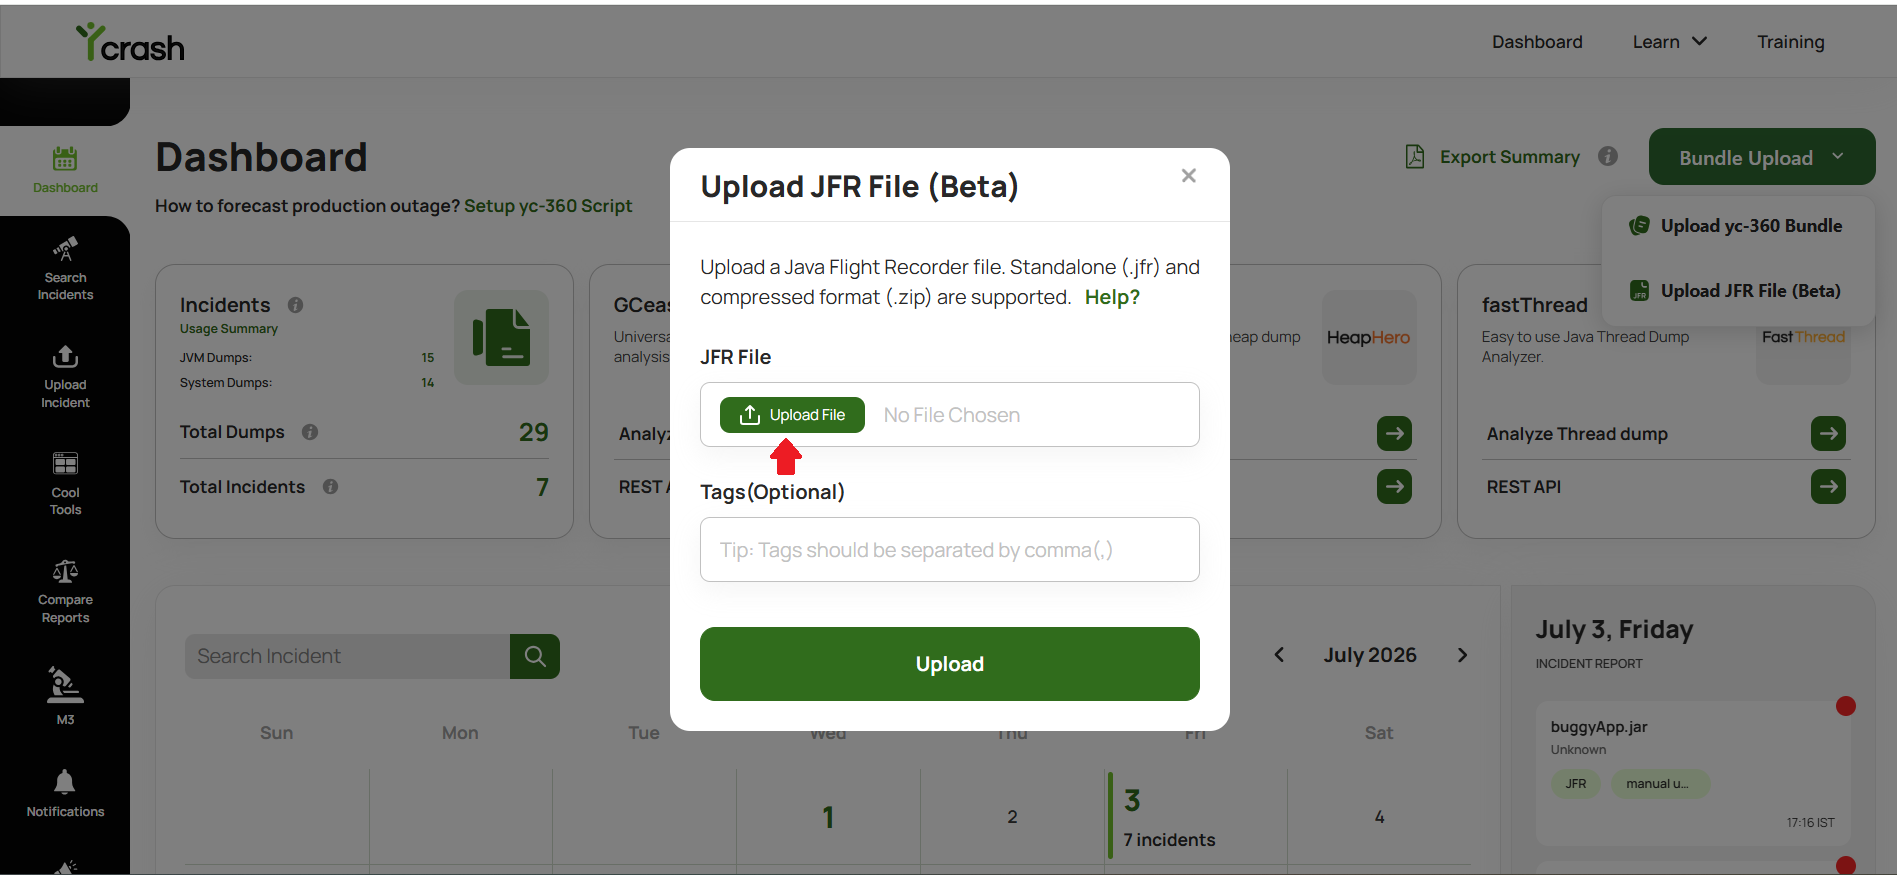
Step 5: Click the Upload button to upload the bundle.
Once the upload is complete, yCrash automatically analyzes all artifacts and generates a consolidated Root Cause Analysis report. Once the upload is complete, yCrash processes the JFR recording and generates a detailed performance analysis report. The report includes insights into CPU hotspots, thread activity, garbage collection behavior, memory allocation patterns, lock contention, I/O operations, exceptions, and other JVM performance characteristics.