# How to Capture Application Log Files?
Capturing application log files is a important step in troubleshooting and monitoring the health of your application. These logs provide valuable insights into the application's behavior, performance, and errors. With the right tools, you can efficiently capture, store, and analyze logs to quickly identify issues and ensure optimal system performance. In this guide, we'll walk you through the process of capturing application log files and how to configure your system to send these logs for analysis, helping you stay on top of potential issues before they impact your users.
# Auto discovery of open log files
We are excited to introduce a powerful new feature in version 2.16 of our software. With this update, our system can now automatically detect and parse log files generated by problematic applications running in your environment. This feature streamlines the process of monitoring and diagnosing issues by providing you with a comprehensive view of your application's logs right from the dashboard.
Supported Environments
Initially, this feature is available exclusively for Linux environments. However, we are actively working on extending this functionality to macOS and Windows platforms in future releases to ensure broad compatibility.
Log File Pattern Recognition
Our auto log discovery feature scans for log files based on specific filename patterns. Currently, it identifies files with the following patterns:
- Files with the extension .log.
- Files containing the word log within their filename (e.g., myapp-logs.txt or serverlog2023.log.gz).
Important Note:
To enable this option, there is no need to manually add any files under the appLogs section. Our system will automatically locate and parse the relevant log files, saving you time and effort.
This automated log file detection and parsing capability significantly simplifies the log management process, allowing you to quickly access and analyze log data within our user-friendly dashboard.
# Configuring Log Files of a Single Application
Prerequisites
Before capturing application logs, make sure you have the following:
- A working installation of yCrash application.
- Access to the yc-360 script's configuration file:
yc-config.yaml
To capture application logs, follow these steps:
Open the
yc-config.yamlfile in a text editor.Locate the
appLogs:entry in the configuration file. If it doesn't exist, you can add it under theoptions:part of the file.Under the
appLogs:entry, specify the log paths for the files you want to capture. You can specify multiple log paths by adding additional entries.
version: '1'
options:
   k: {API_KEY}
   s: {http://MY-YC-SERVER:PORT}
   j: {JAVA_HOME}
   appLogs:
    - D:\ycrash-workstation\logs\yc.log$App1
    - D:\ycrash\logs\yc.log$App2

   a: {APP_NAME}
2
3
4
5
6
7
8
9
10
{API_KEY}: This API key will be provided with your license file.
{http://MY-YC-SERVER:PORT}: Specify the host and port in which the yCrash server is listening. Example: http://localhost:8080/
{JAVA_HOME}: The directory path where Java is installed in your environment. The j argument is required for Java applications only. Not applicable for .NET applications and Node.js applications.
appLogs: Specify the path where the app log is present.
Make sure to replace D:\ycrash-workstation\logs\yc.log and D:\ycrash\logs\yc.log with the actual paths to your log files.
- Save the
yc-config.yamlfile and start the yc-360 script with the updatedyc-config.yamlfile.
# Configuring Log Files of a Multiple Application
Prerequisites
Before capturing application logs, make sure you have the following:
- A working installation of yCrash application.
- Access to the yc-360 script configuration file:
yc-config.yaml.
To capture application logs, follow these steps:
Open the
yc-config.yamlfile in a text editor.Locate the
appLogs:entry in the configuration file. If it doesn't exist, you can add it under the options: part of the file.Under the
appLogs:entry, specify the log paths for the files you want to capture. You can specify multiple application log paths by adding additional entries.
version: '1'
options:
   k: {API_KEY}
   s: {http://MY-YC-SERVER:PORT}
   j: {JAVA_HOME}
   appLogs:
    - D:\ycrash-workstation\logs\yc.log$App1
    - D:\ycrash\logs\yc.log$App2
   processTokens:
    - buggyApp.jar$App1
    - webapp-runner$App2

   a: {APP_NAME}
2
3
4
5
6
7
8
9
10
11
12
13
{API_KEY}: This API key will be provided with your license file.
{http://MY-YC-SERVER:PORT}: Specify the host and port in which the yCrash server is listening. Example: http://localhost:8080/
{JAVA_HOME}: This should be the directory where Java is installed on your system.
appLogs: Specify the path where the app log is present.
Make sure to replace D:\ycrash-workstation\logs\yc.log and D:\ycrash\logs\yc.log with the actual paths to your log files.
Example:
- processToken
"buggyApp.jar"is tied to"App1"and its log path is set to"D:\ycrash-workstation\logs\yc.log$App1". - The
"$App1"suffix indicates that this log file is specific to the application named"App1". - Similarly,
"webapp-runner"is associated with"App2"and the logs are located at"D:\ycrash\logs\yc.log$App2".
- Save the
yc-config.yamlfile and run the yc-360 script with the updatedyc-config.yamlfile.
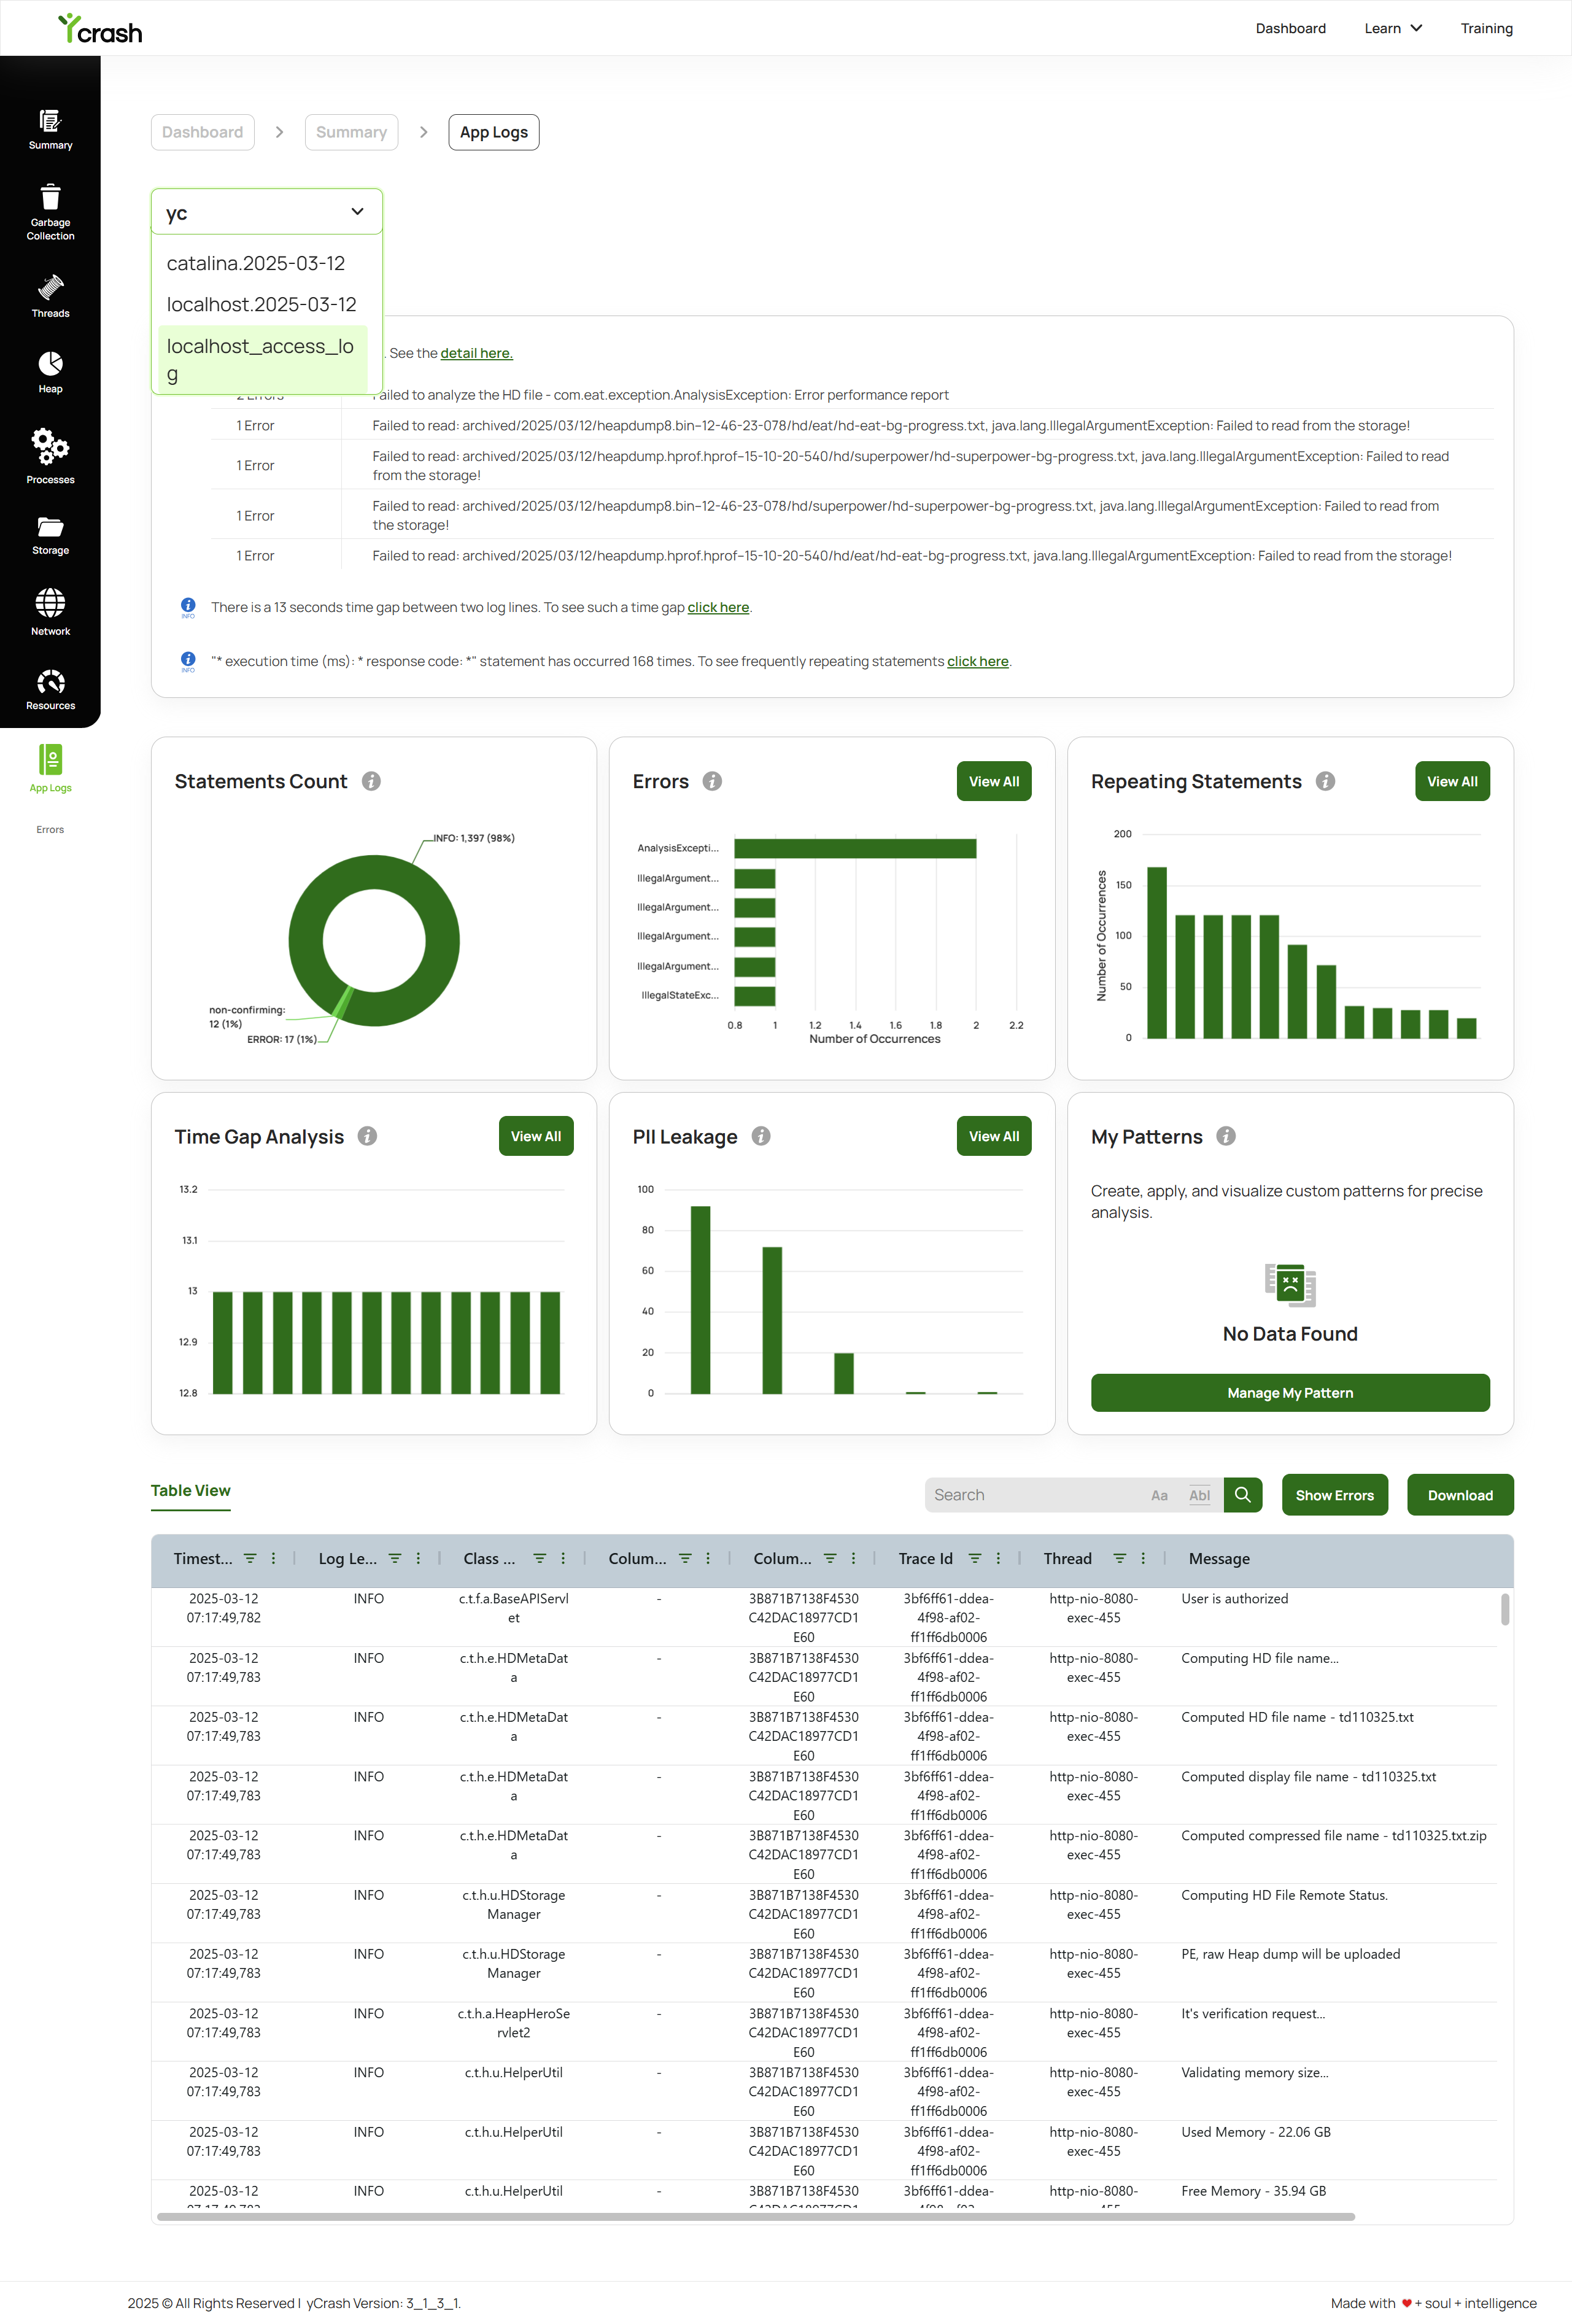
# How yCrash Displays the Captured Application Logs
Once the yc-360 script captures your application logs, whether a single log or multiple logs, the yCrash UI analyzes them and displays a structured App Logs report. This view highlights:
- Errors detected in each log file
- Statements count (log level stats like ERROR, INFO, WARN, etc.)
- List of top errors
- Time gaps between log entries
- Repeating log statements
- PII statements (sensitive data patterns)
- Custom patterns (user-defined patterns matched in log lines)
- Table view of errors
Below is an example screenshot of the App Logs report: